
Bitcoin’s rally on 26 July marked the fourth time since May that the crypto-asset had re-tested its resistance at $10,000. On the previous three occasions, after reaching $10,000, an immediate correction had ensued. In fact, over the past few months, BTC’s struggles with the $10,000 level have been well-documented.
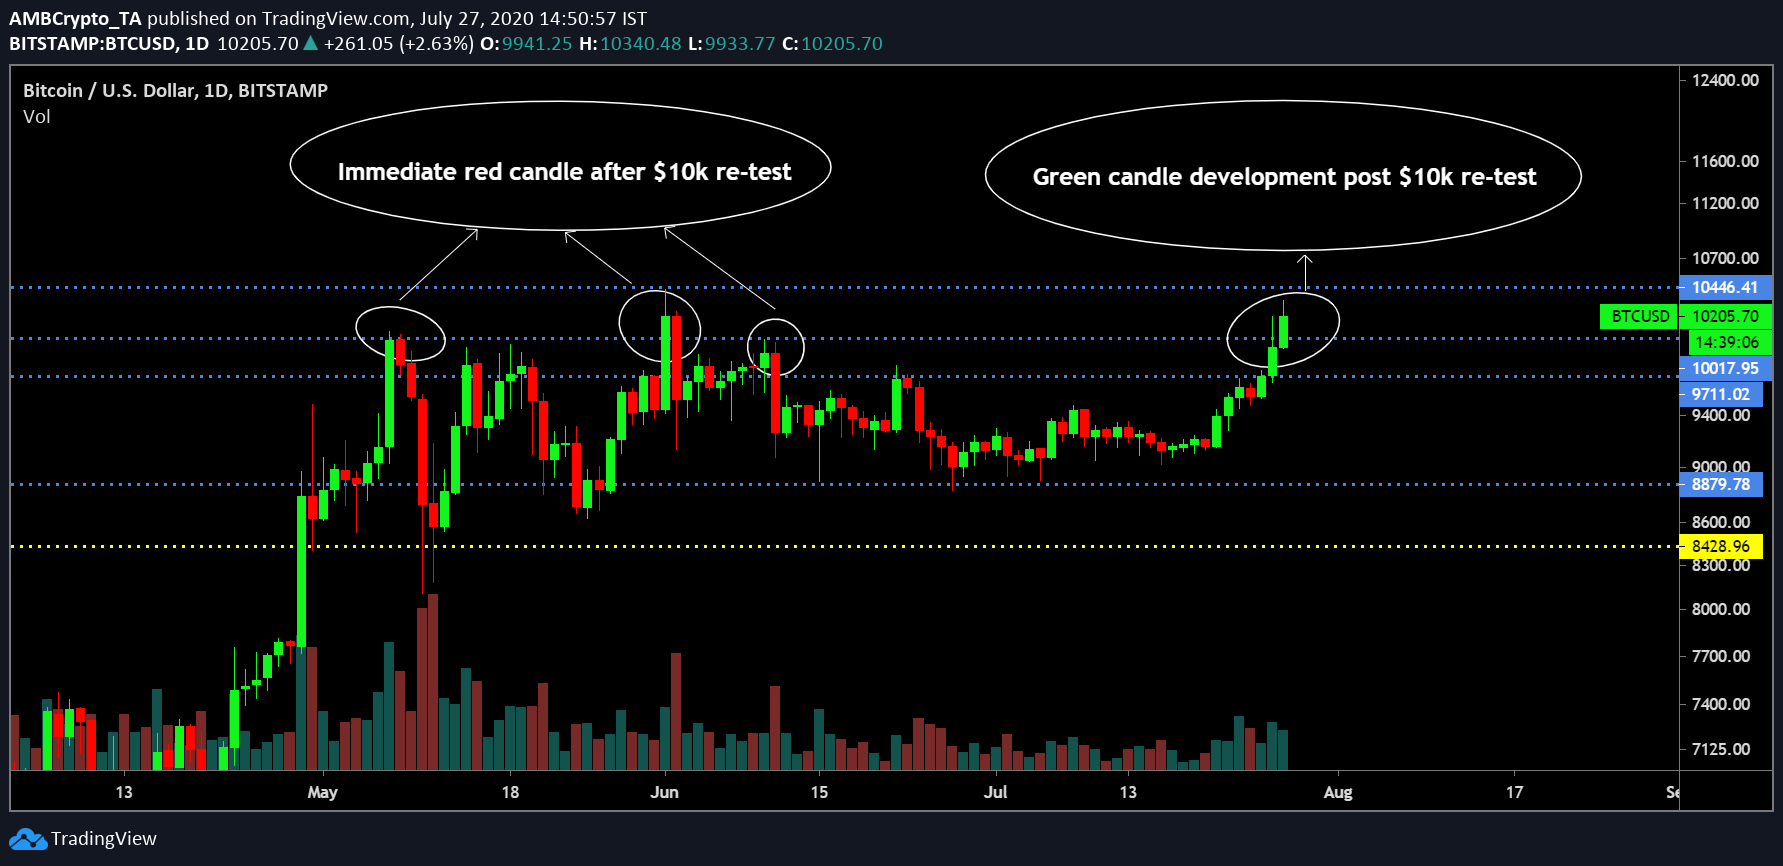
Source: Trading View
As observed in the attached chart, the crypto-asset is on its way to record a 2nd consecutive positive day after its $10,000 retest, a development that will be completely different from its previous experience with the resistance level.
However, that wasn’t the only difference in trend during Bitcoin’s recent rally.
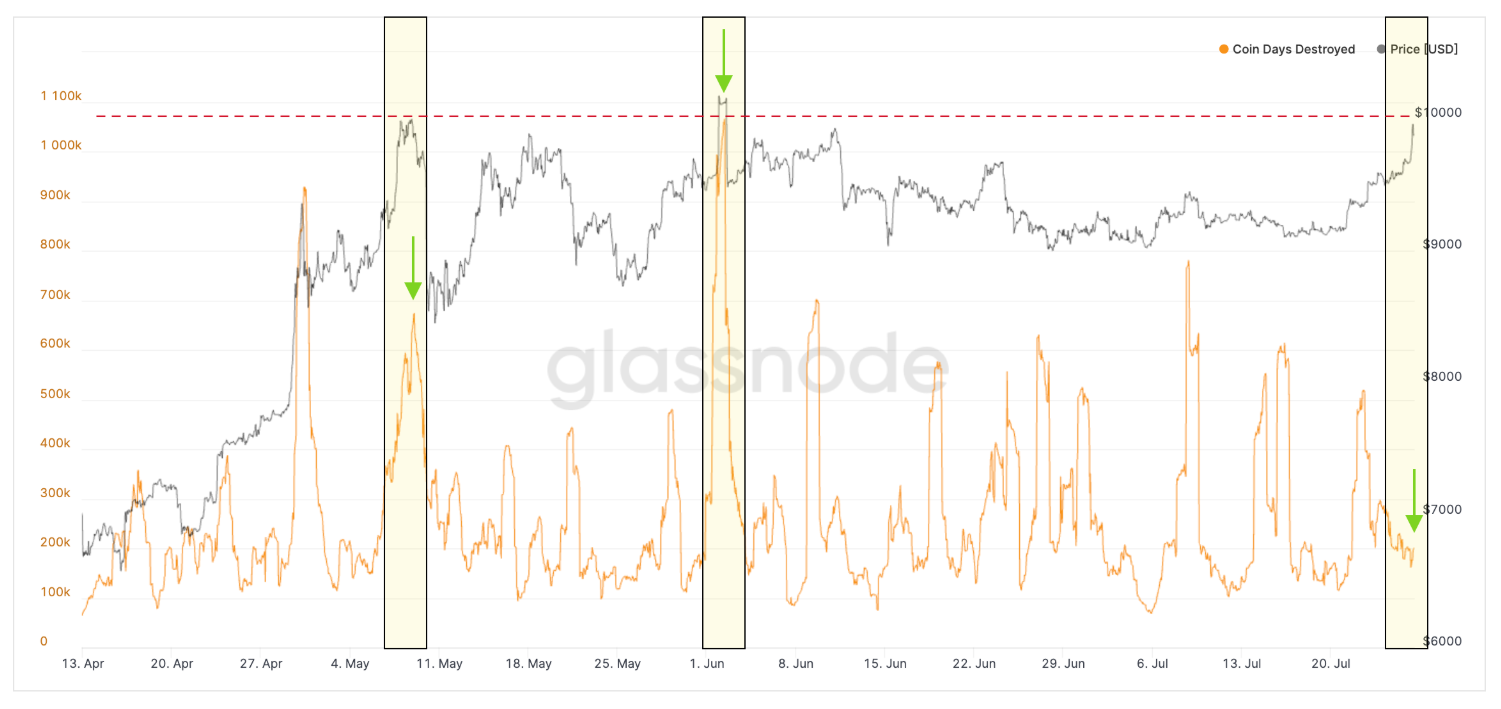
Source: Glassnode
According to data provided by Glassnode, contrary to the previous two times Bitcoin touched $10,000, Bitcoin Days Destroyed has decreased on the charts rather than registering a high, as was observed earlier in May and June.
Bitcoin Days Destroyed is a metric that is used to estimate the transaction volume. Whenever low BDD is pictured, it is a direct indication of hodling activity. As previously discussed, hodling sentiment in 2020 had already been on the rise, but the recent drop in BDD, when compared to May and June, implies that the transaction volume has been extremely low during this current positive turnaround. Earlier in the year, Glassnode CTO Rafael Schultze-Kraft had said,
“The average Coin Days Destroyed per year has been decreasing and is at its lowest level since 2016.”
Hence, when his own evaluation is taken into account, it can be noted that the BDD is in the lowest of the low range in the last 5 years.
Now, in typical contrasting fashion, Skew charts indicated something different entirely.
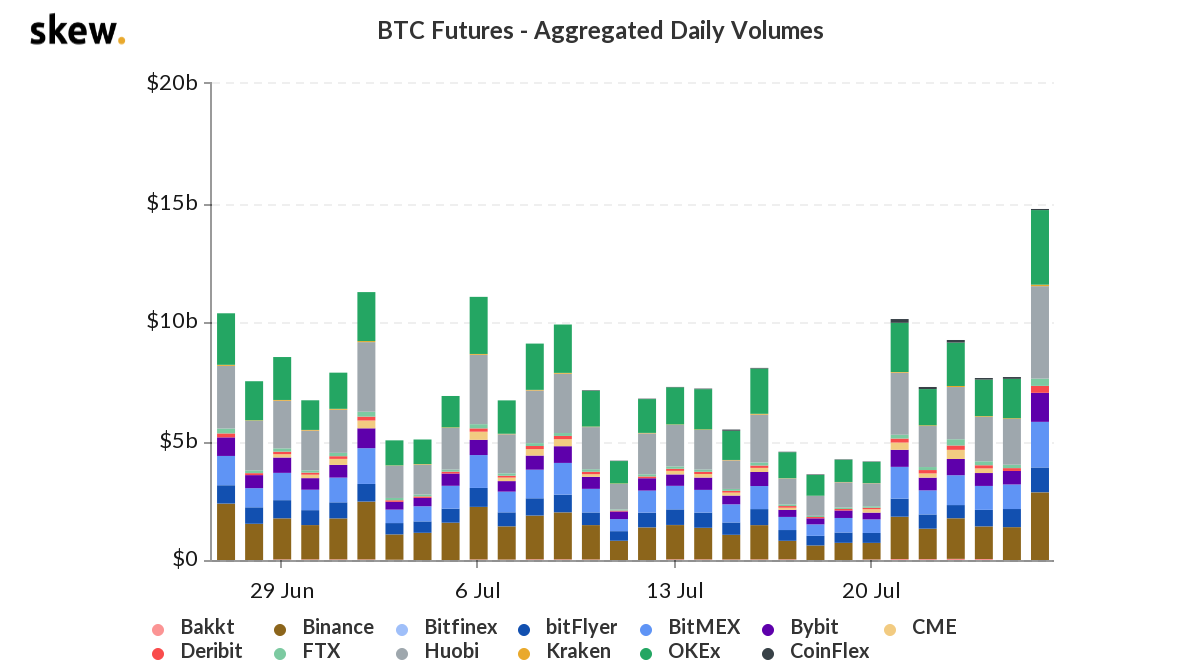
Source: Skew
As pictured in the attached analysis, Daily Aggregated Spot volumes for Bitcoin were on a monthly high on 26 July, something that shouldn’t have been the case if transaction volume was supposedly low during the rally.
It must be noted, however, that Glassnode had mentioned that Bitcoin Days Destroyed might not be an accurate evaluation of the economic activity prevailing in the industry. This looks like the case at the moment.
What does this mean for the present Bitcoin rally?
One word: Uncertainty, like always.
Such disparity between on-chain fundamentals suggests that the present rally could be based on weak foundations. Hence, a correction phase may or may not take place on the charts.
When evaluated at press time, the situation was looking more positive than its previous re-test (As pictured in the 1st chart). Hence, the benefit of the doubt has to be pointed towards a positive turnaround.
Further clarity will be attained over the next week as a play towards higher consolidation continues to evolve in the markets, without outcasting the chances of a recurring pullback. At press time, Bitcoin was valued at $10,250 with a market cap of $188 billion.
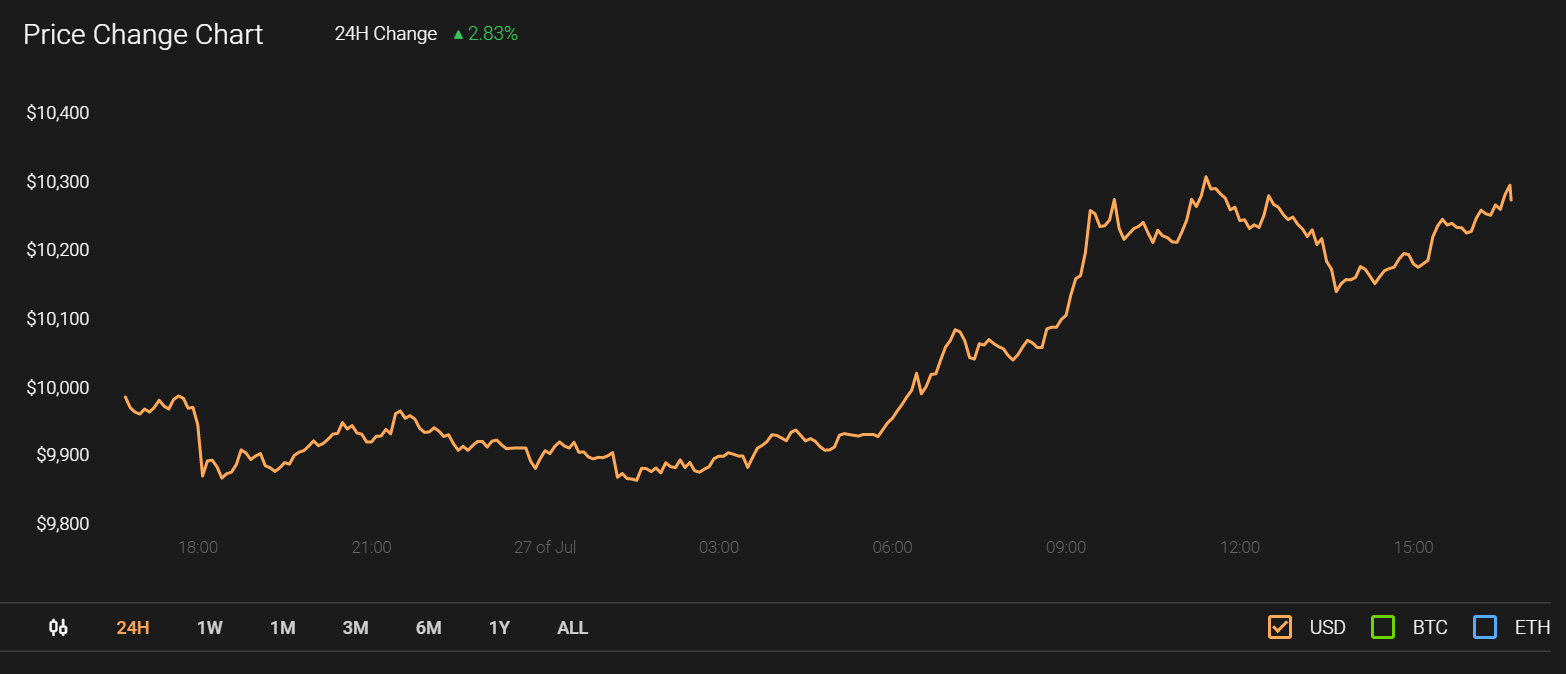
Source: Coinstats