Flippening alert – Why Ethereum’s market cap could be taken over by ERC-20’s

Ethereum has been sharing the limelight with Bitcoin this year following its exponential growth. This growth, however, was churned out by the growing interest generated among users through Decentralized Finance [DeFi] and the thought of making use of smart contracts to leverage positions in the market. With DeFi gathering momentum, ERC-20 tokens too were grabbing eyeballs with the opportunity for tremendous returns. In fact, Serum Token [SRM], an ERC-20 DeFi token, registered a 1500% surge in its price within 12 hours of listing.
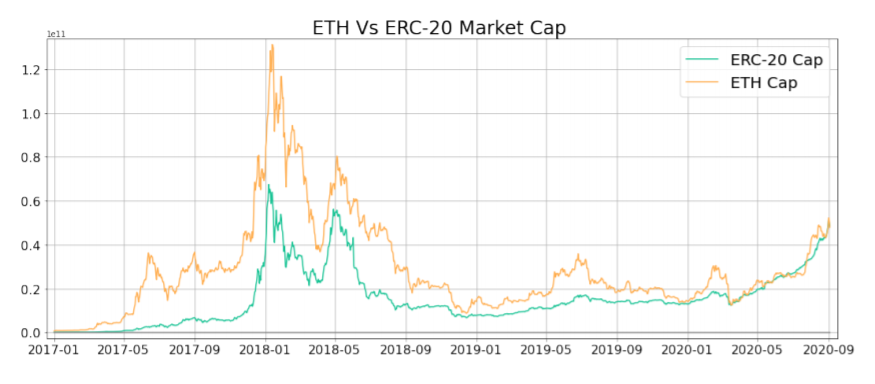
With the DeFi boom carrying multiple ERC-20 tokens to new heights, the market cap of ERC-20 has been exceeding that of Ethereum’s lately. Look no further than the number of projects out there as according to Santiment, there are 853 ERC-20 projects currently, excluding zero-cap projects.

Source: Santiment
The attached chart indicated that the market cap of Ethereum and ERC-20 tokens had been moving in tandem. However, ERC-20 capitalization has been less volatile, recording steady, uninterrupted growth despite ETH’s prolonged consolidation on the charts. The reasons for the same included not just the DeFi boom, but also Yield Farming platformers built on top of Ethereum.
This was the reason why in March, when the market collapsed, DeFi tokens were very quick to bounce back, briefly taking over the market capitalization of Ethereum. This was first among the many flippenings that took place this year. Ever since Black Thursday, the market cap of Ethereum and ERC-20 has been neck-and-neck. In fact, data suggests that over the past 6 months, ERC-20 coins have ‘out-capped’ Ethereum for a total of 58 days, with the same, at the time of writing, just -1% below Ethereum’s market cap on the charts.
Further, the correlation between ETH and ERC-20 markets has remained mostly positive in the green zone, a sign of the two market caps moving in a uniform direction.

Source: Santiment
It should be noted, however, that this strong correlation has seen frequent tremors, with the same close to 0.87, at the time of publication.
From the chart attached herein, it can be deduced that the drop in correlation was prominent during a period of increased price volatility for Ethereum. In fact, this was famously observed in 2017 when ETH’s price topped and again in June 2020, when ETH price consolidated. The following drop in correlation, especially in 2020, hence, could have been an indicator of the DeFi breakout.
Therefore, it can be argued that it is only a matter of time before the ERC-20 market capitalization takes over Ethereum’s, as the cryptocurrency has been hit by a lot of sell-off pressure recently, causing its price to tumble to $358.

Source: Coinstats


