Ethereum
Ethereum’s push above $229 requires patience and momentum

Over the past 24-hours, the digital asset industry is starting to act lively. The largest altcoin Ethereum registered some movement after consolidating within a $10 +/- of $210 since May 22nd. However, the trend appeared to shift in the charts, as a fairly bullish scenario was observed.
Ethereum 1-day chart

ETH/USD on Trading View
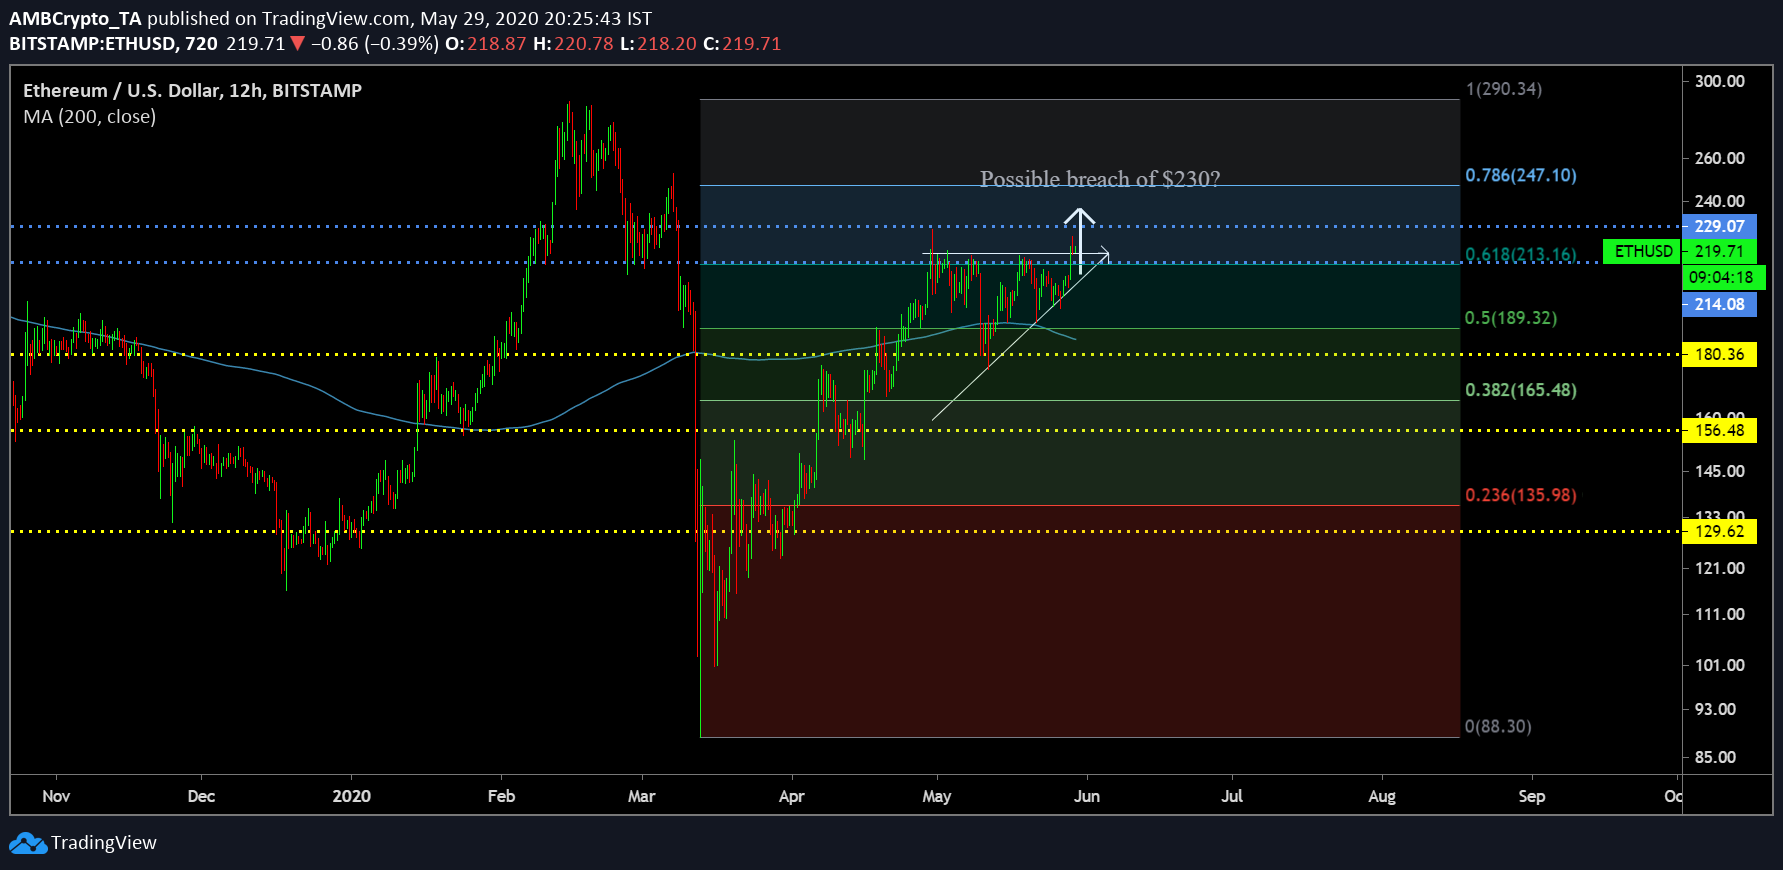
On close observation, it can be identified that Ethereum’s price hadn’t been able to breach resistance at $214 since the start of April, but over the past 24-hours, the asset has managed to surge past the mark. At press time, Ethereum was valued at $219.
The breakout came at the end of an ascending triangle formation which started to take shape towards the end of April. At the time of writing, Ethereum may have been over the resistance but it was imperative for the asset to close above the immediate support at $214. With the new-found momentum, a spike up to $230 could be in the cards for ETH. Last time Ethereum was priced at $230 was back on March 9th, 2020.
The 200-Moving Average continued to remain as active support and according to Fibonacci retracement lines, the asset had managed to bypass 0.618 line according to the charts.
Ethereum’s 4-hour chart
ETH/USD on Trading View
The reality is, in the past, we have seen similar behavior. Although Ethereum has managed to breach above $214, it is fairly important to maintain its position above as well. Now considering the 4-hour chart, Ethereum has done fairly well to keep above the uptrend but a major market indicator could be indicative of a bearish reversal.
Relative Strength Index or RSI suggested that the price of ETH had been pushed into the overbought zone. Now on a general scale, it is bullish at present but according to the above chart, Ethereum has faced quick pull-backs right after over the past 45 days.
The increase in sell pressure could possibly bring down Ethereum’s valuation and the price might plummet below $214 again.
Conclusion
From a bullish side of things, the scenario might not improve from here on at least till the first week of June. However, short-term rallies exhibit the fact that the bullish narrative was not completely down and out as assumed towards the end of last week.

