Analysis
Ethereum’s price may suffer from bearish waves as coin breaches ascending channel

Ethereum [ETH], unlike many other cryptos, fought the bears in the market and emerged out of September with 8.44% gains. The beginning of October has been against putting the price of the second-largest crypto to test, as the price stood at $176.50, at press time.
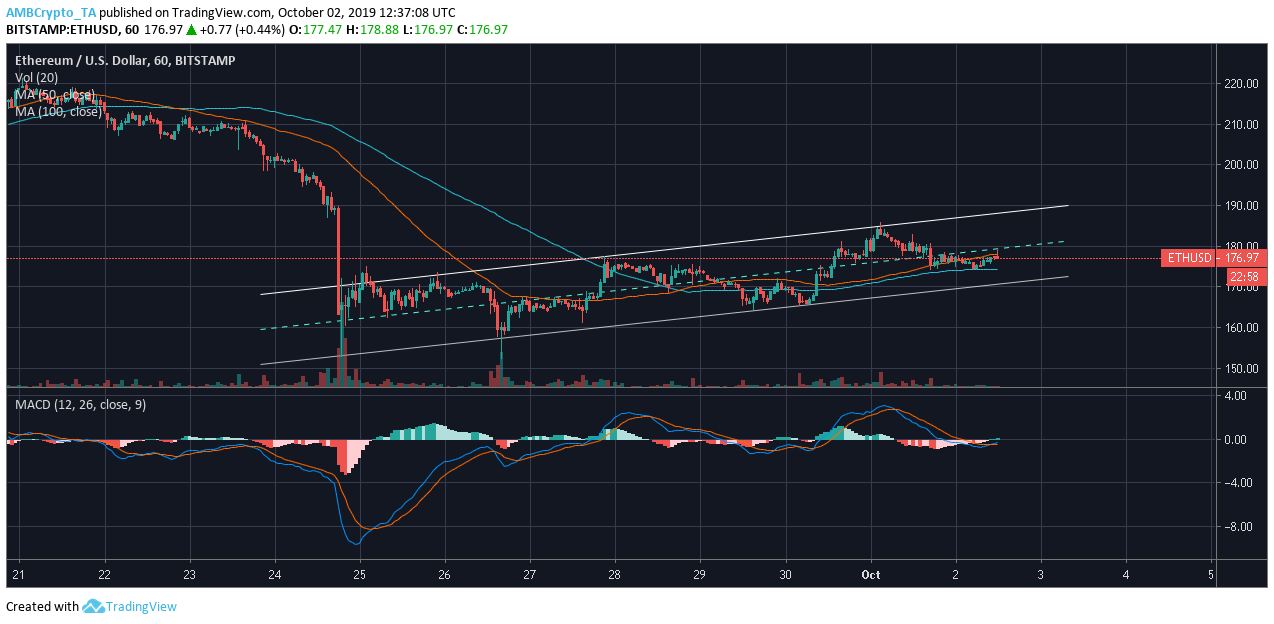
The short-term chart for Ethereum is indicative of the bearish diversions in the market.
1-hour

Source: Trading view
Ethereum’s one-hour chart reflects an advancing ascending channel over the past seven days. During this period, ETH has noted 2.99% growth and the channel has extended, marking higher highs at $170.60, $177.43, and $185, and higher lows at $153.04, $157.43, and $165.48. As the price advances within the rising channel, a bearish breakout might be imminent.
The Moving average 50 was above the Moving Average 100, indicating a bullish wave in the market. MACD too reflected a bullish market as it recently overtook the signal line on the charts.
4-hour
Source: Trading view
The 4-hour chart for Ethereum suggested the formation of an ascending channel, marking higher highs at $171.78, $176.95, and $183.67 and higher lows at $153.44 and $157.57. The volume has also been observed to consolidate, with the price being restricted within the channel and a breakout towards the bearish end seems closer.
The 50 moving average was under the 100 moving average after a recent crossover, reversing the previous bullish trend. The MACD line, which appeared to be leading, may undergo a crossover soon to reverse the bullish trend into a bearish one.
Conclusion
According to the one-hour and the four-hour chart for Ethereum, a breach in the bearish ascending channel is suggested to be devaluing the price of Ethereum.
