Ethereum
Ethereum’s bearish woes may have a deadline on the horizon

A potential trader looking at Ethereum at the moment will be demoralized with its current price movement. At press time, the token indicated a price growth of 1.23 percent at press time but prior to that, ETH had slumped over 8 percent on 14th August.
Ethereum’s one-day chart

Source: Trading View
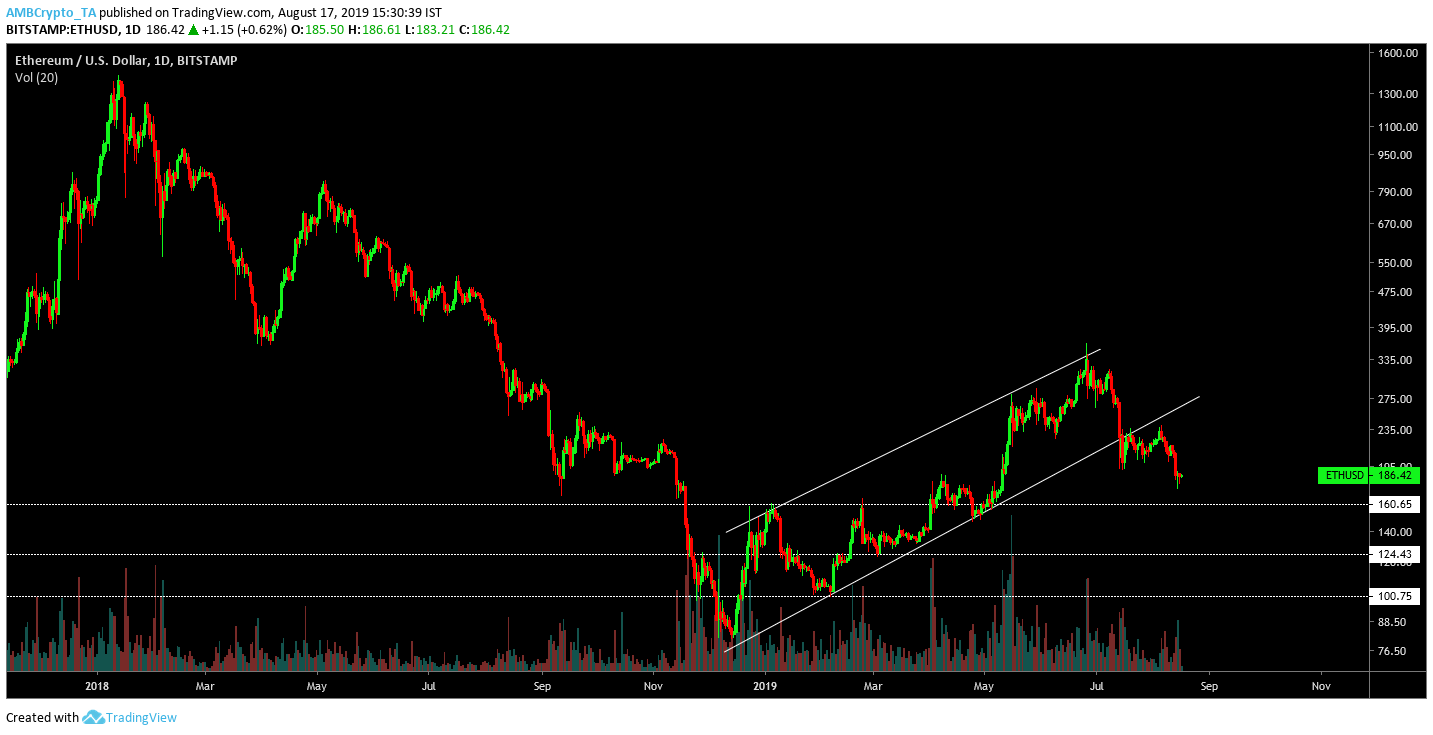
If a trader was looking at ETH’s chart before the fall on 14th, they would have extremely optimistic about ETH’s valuation. The price of Ethereum had adhered to an ascending channel since the start of 2019 and the price had progressively maintained growth over the last few months. ETH’s price continued to bounce off the channel line, forming higher lows in the chart up until the breakout took place.
Ethereum’s ardent followers would have disappointed as the pattern was breached in the opposite direction towards a bearish outbreak rather than following up on a bullish move upwards.
The support line of Ethereum was drawn at three different price points and the immediate support was placed at $160.65, followed up by supports at $124.43 and $100.75.
However, the one-day charted had pictured the formation of another pattern at press time.
Source: Trading View
It was observed that the current price movement of ETH was indicating the formation of a falling wedge in the chart. In light of the current pattern, there is a possibility the price of ETH would consolidate lower down to the range of around $160 in the charts below a predicted bullish breakout transpires in the market. The descending line formed over the trade volume for Ethereum confirmed the validity of the descending wedge, further solidifying an indicated bullish breakout somewhere in the middle of September.
Conclusion
Looking at the current patterns, there is still hope for Ethereum in the current bear market as bulls indicated that they might arrive in time to save its valuation.

