- Ethereum faced some turmoil after recent volatility muted bullish sentiment.
- Despite this, the usage and holder sentiment remained strong, which is good news for investors.
Ethereum [ETH] saw a drop in its estimated leverage ratio metric over the past month. This downward trend came at a time when prices managed to scale past significant resistance levels.
The volatility behind Bitcoin [BTC] was one contributing factor. BTC threatened to break out past $44.3k multiple times (and accomplished it twice), only to fall back within the range formation of the past six weeks.
This has inspired some doubt in the minds of ETH speculators and investors. Additionally, Ethereum has also lagged behind Bitcoin in terms of price appreciation. AMBCrypto looked closer at relevant on-chain metrics and found that investors have reason to be confident.
What are the implications of the Estimated Leverage Ratio falling?
When the prices of ETH go up but the leverage ratio trends downward, it points toward reduced speculative activity and leverage trading. This could be due to diminished bullish sentiment. Alternatively, it could also be indicative of a rally that is driven by the spot markets and organic demand instead of Open Interest in the futures market.
The chart showed that the metric saw sharp drops in the past month. The 14-day simple moving average has trended downward. However, the leverage ratio saw a sizeable bounce after 6 January as prices rebounded higher.
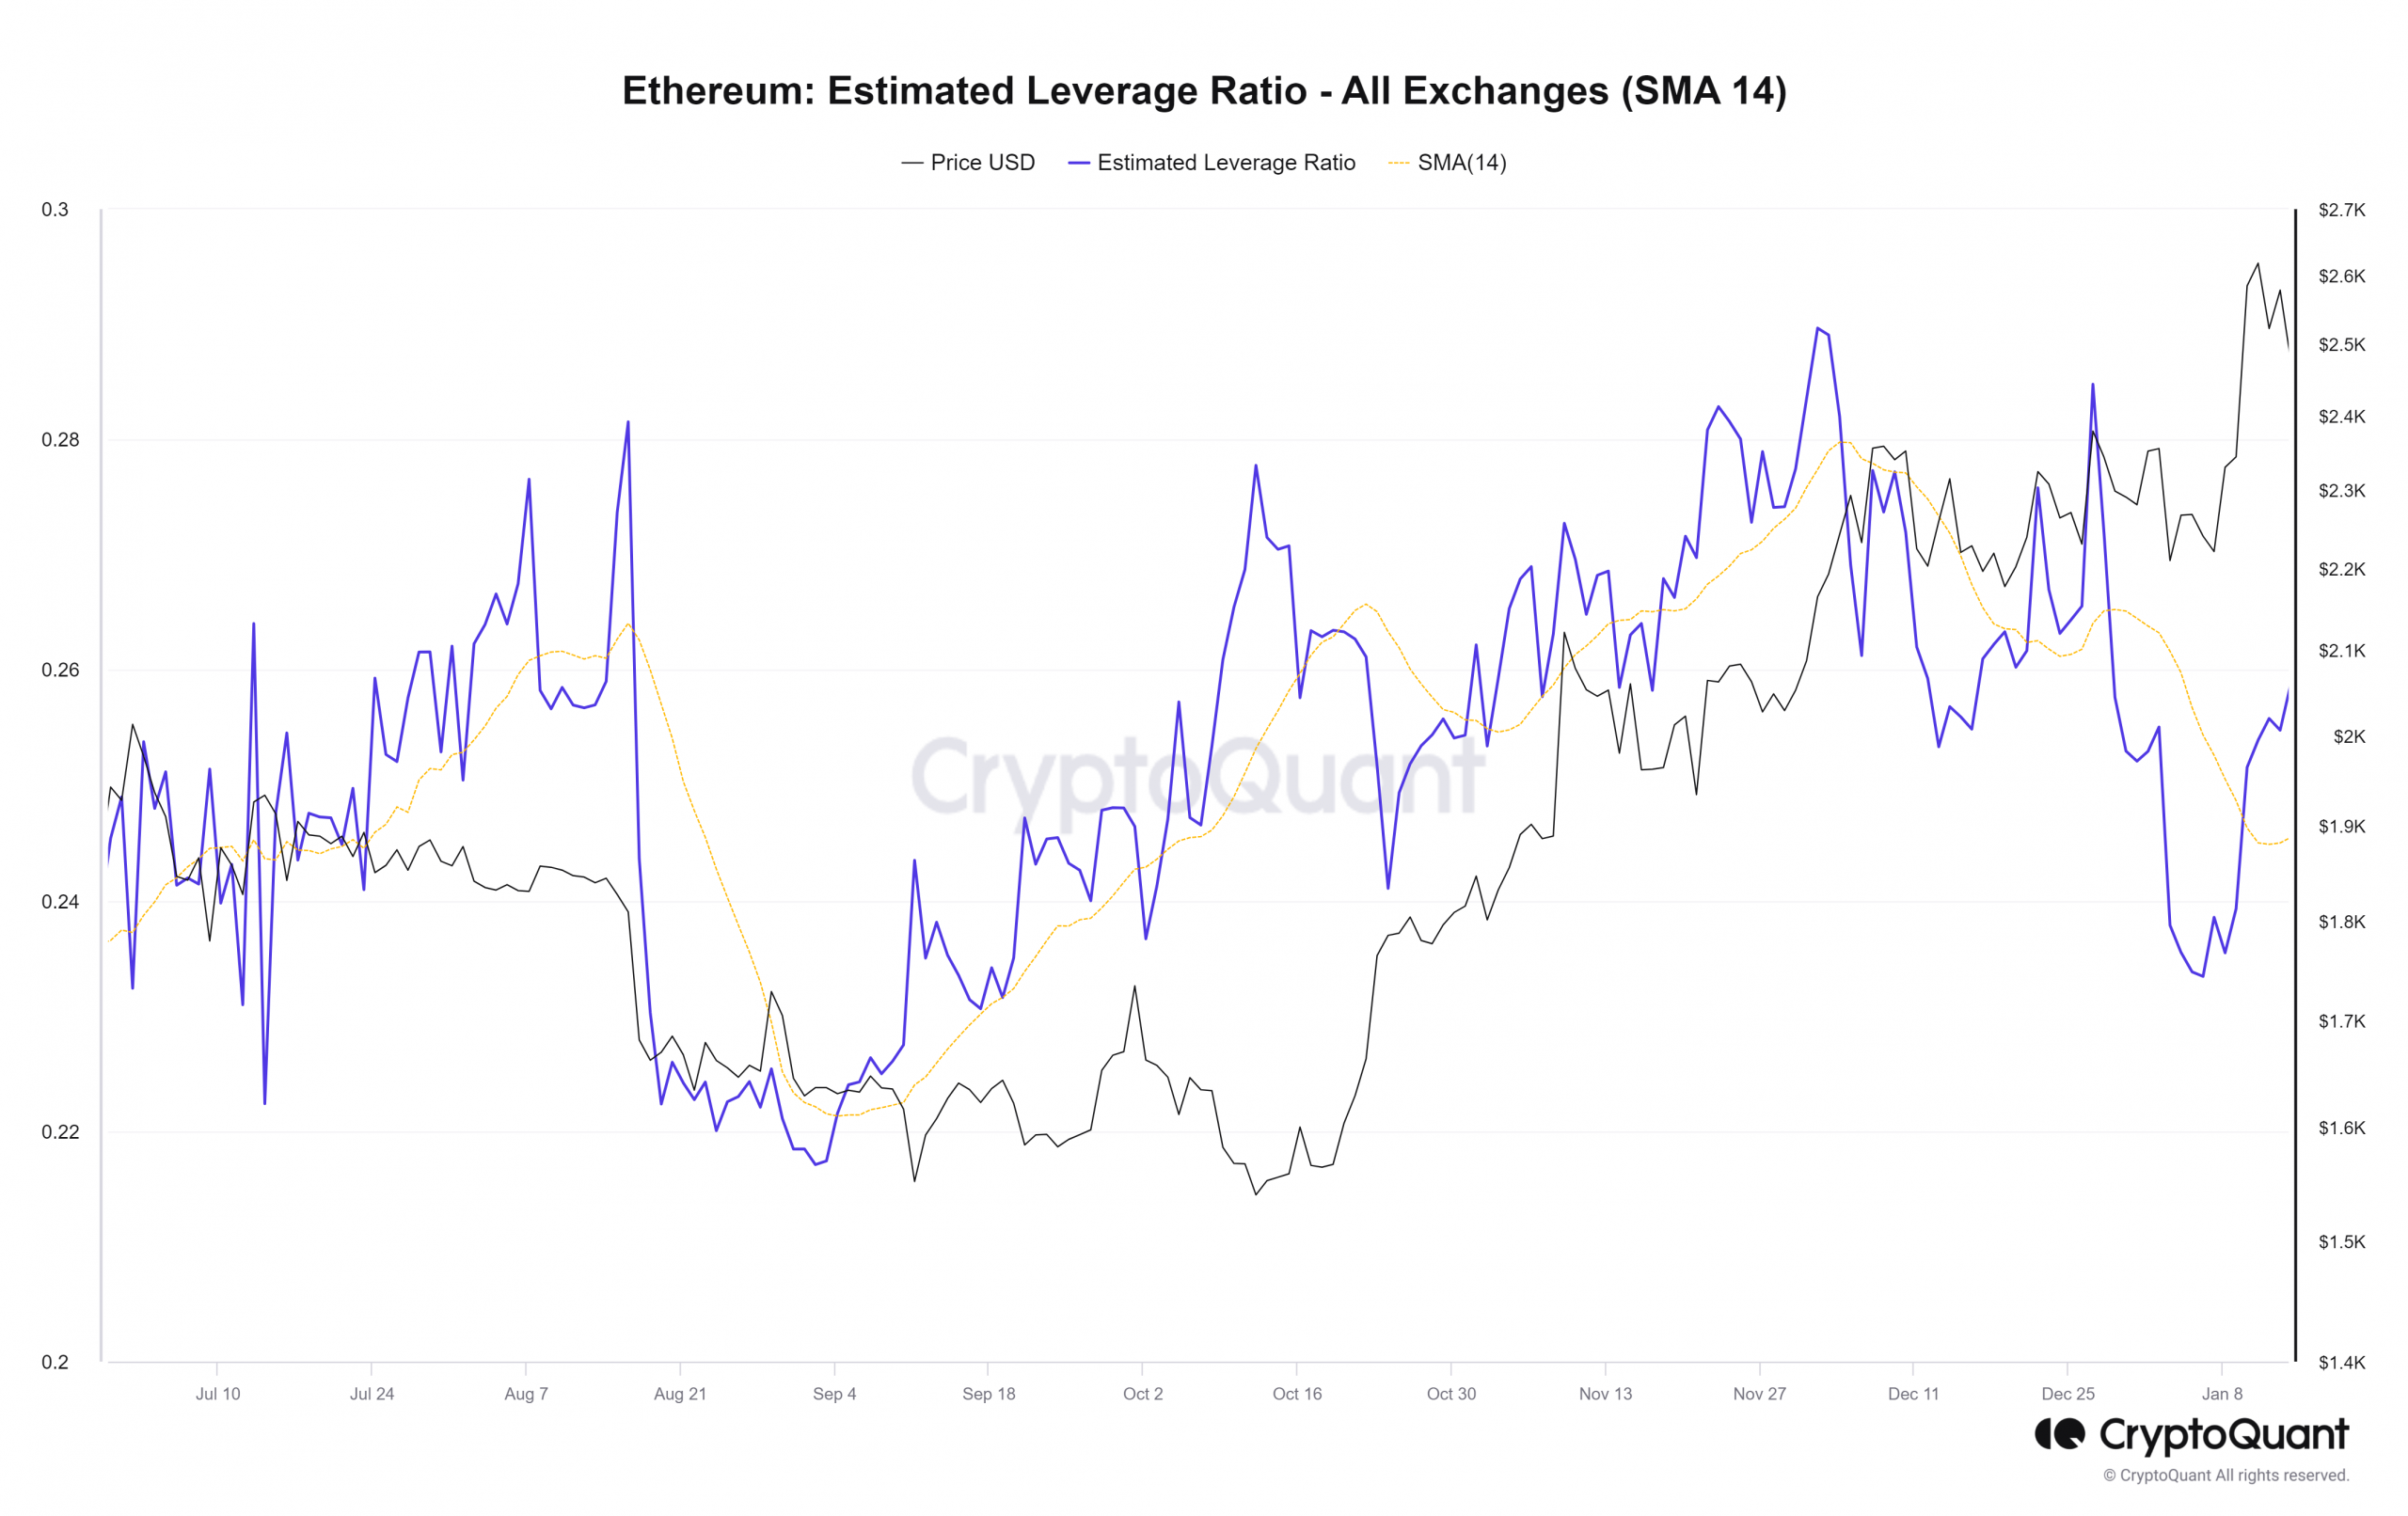
Source: CryptoQuant
The volatility in the past few weeks also likely forced leveraged traders to close their positions or liquidate them. This also likely led to a falling estimated leverage ratio.
To understand whether an accumulation of ETH in the spot markets was a significant contributing factor, AMBCrypto analyzed the exchange outflow metric.
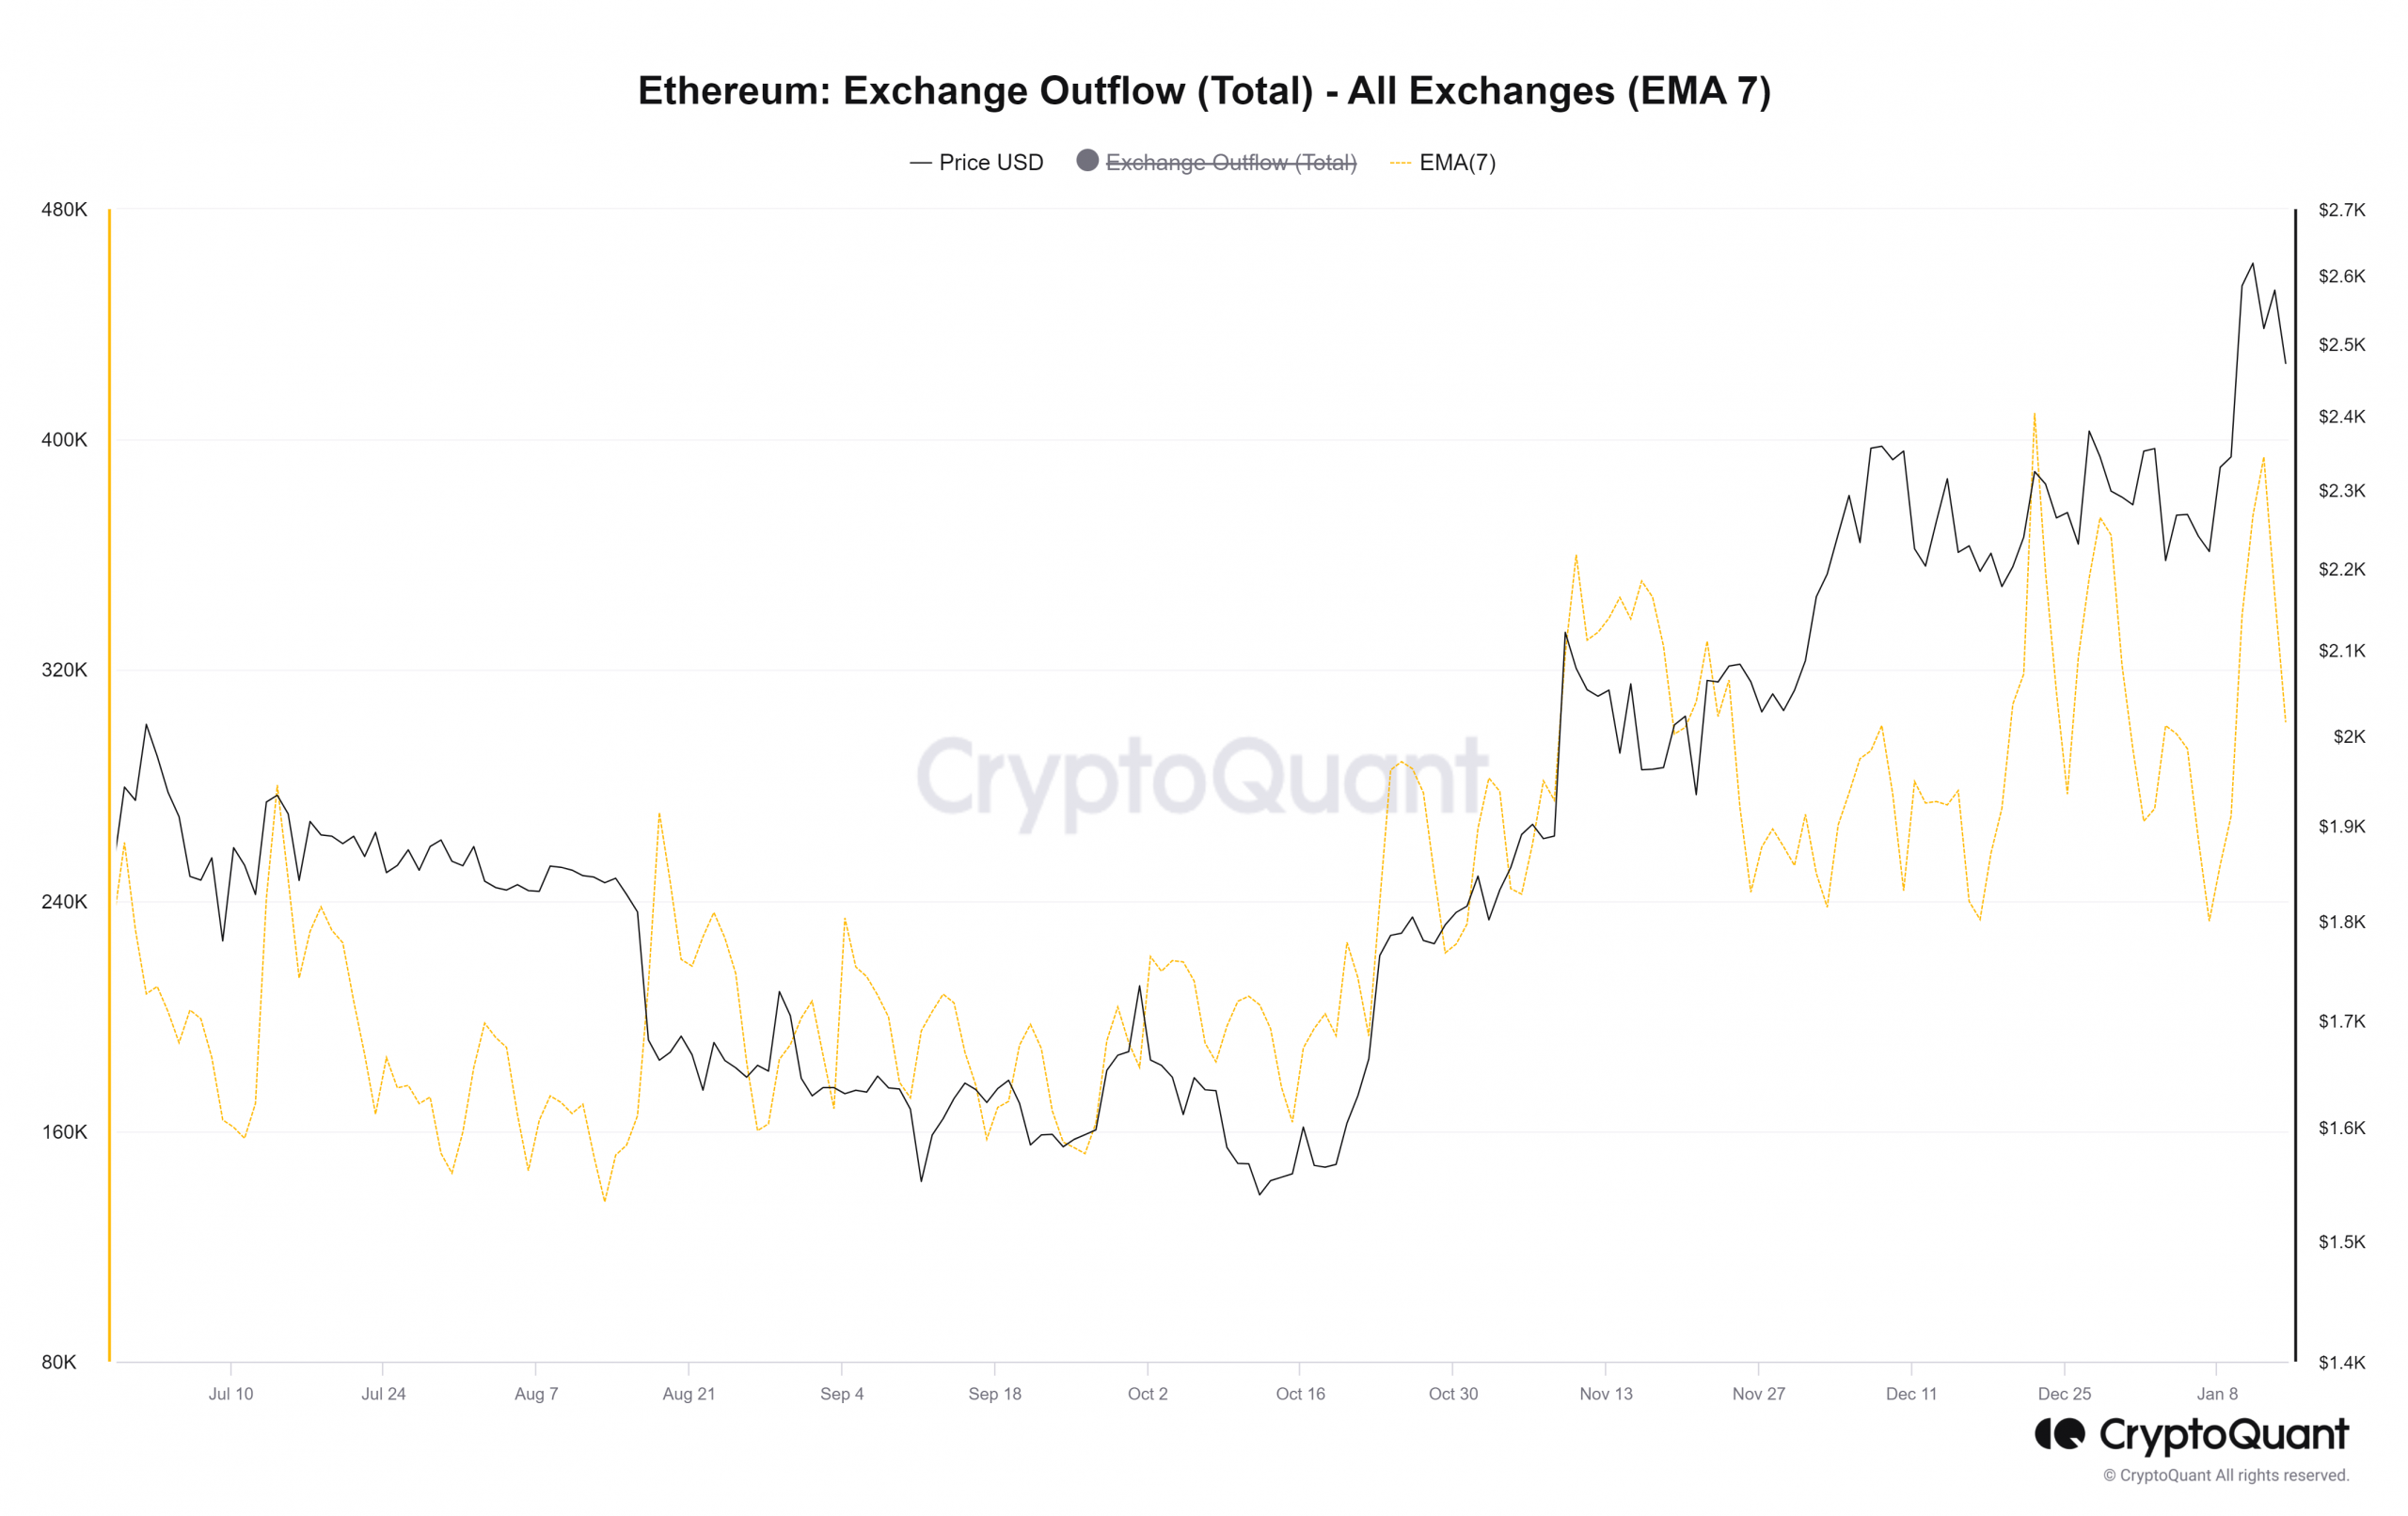
Source: CryptoQuant
The 7-day EMA of the exchange outflow was used to see if it trended upward noticeably. While there were individual spikes upward, it was not like the steady uptrend of October.
This suggested that the idea of a market-wide accumulation of ETH in the spot markets was not backed strongly by the outflows.
Thus far, the evidence points toward profit-taking and reduced risk-taking tendency in the Futures market. Once again, given the volatility of the past three weeks, the explanation held credibility. Yet, there’s more to the story.
The reasons why investors could take heart from the recent developments
To highlight the market sentiment, AMBCrypto took a look at the Open Interest chart of Ethereum. Once again, the 7-day EMA gave a clearer picture of the current trends.

Source: CryptoQuant
It showed that since the 9th of December, the OI has oscillated significantly instead of the uptrend it had been on since mid-September.
The decline in OI came alongside strong price drops, especially during the rejections that ETH faced at $2.4k throughout December.
The recent price action suggested that ETH has not found its local top. The multiple rejections at $2.4k were followed by a huge surge in prices after the BTC spot ETF approvals came.
This saw the prices touch the $2.7k mark, breaking the resistance zone at long last.
To understand if holders are confident of further gains, the MVRV ratio was analyzed, among other metrics. The MVRV ratio nearly reached December’s highs during the rally.
More importantly, it remained well above zero to show that a large amount of holders were in profit at press time.
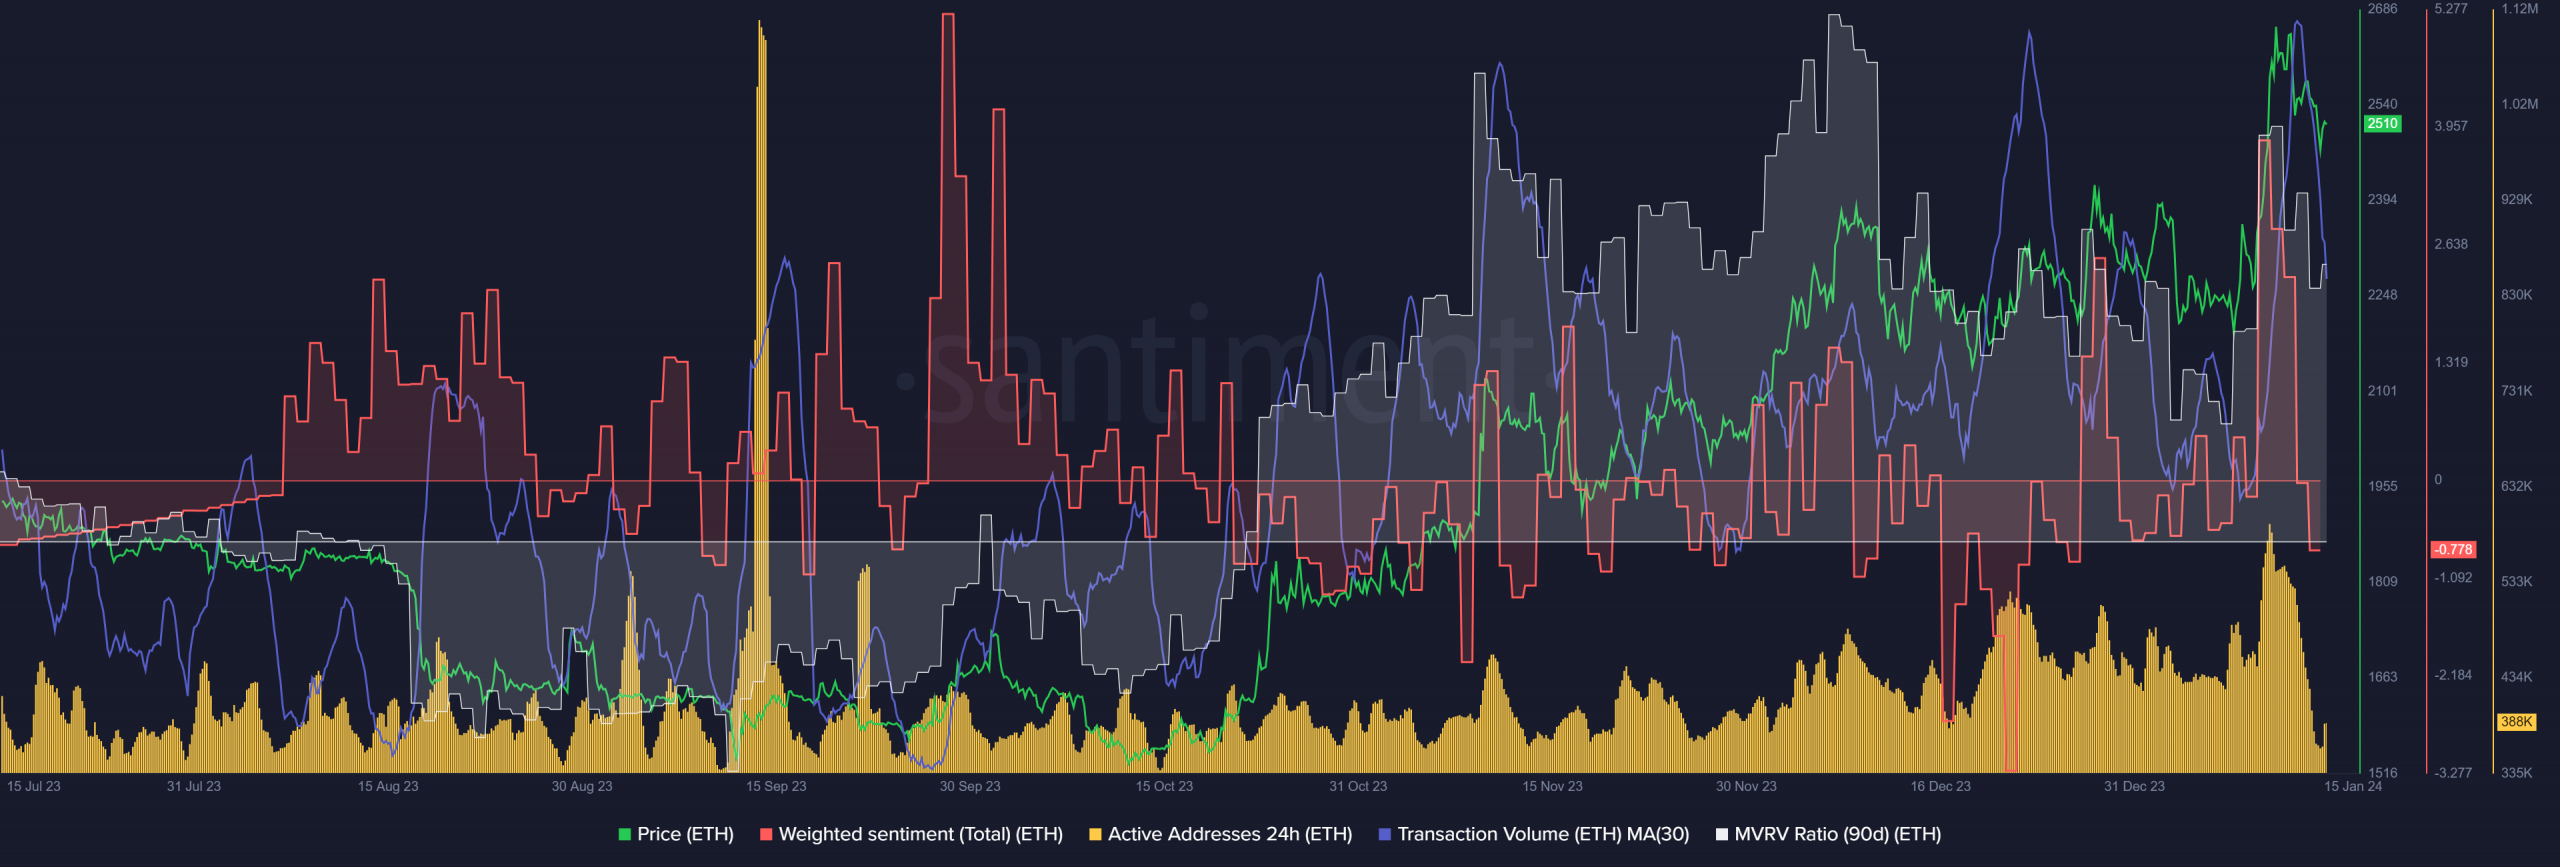
Source: Santiment
The Weighted Sentiment also saw a strong peak during the price rally, but has fallen since then. The Active Addresses has steadily trended higher in the past two months, which indicated increased engagement and potential demand.
Additionally, the transaction volume (30-day SMA) has not fallen dramatically either. It has maintained a roughly steady level in the past two months and saw occasional large peaks as activity surged enormously.
Once again, this was a sign of steady network usage.
Read Ethereum’s [ETH] Price Prediction 2024-25
Even though the price volatility hurt futures traders and diminished the bullish sentiment, the on-chain metrics showed that it was business as usual.
The high MVRV ratio was encouraging, even though the exchange outflows were not particularly convincing. This is why Ethereum’s prices are expected to climb higher in Q1 2024.