
Ethereum was down by over 10% in the last 24 hours. The latest plunge propelled the coin to break well below its key support point of $248.
The coin stood at a value of $206.3 while holding a market cap for $22.7 billion and a 24-hour trading volume of $22.9 billion.
Ethereum 4-hour Chart:
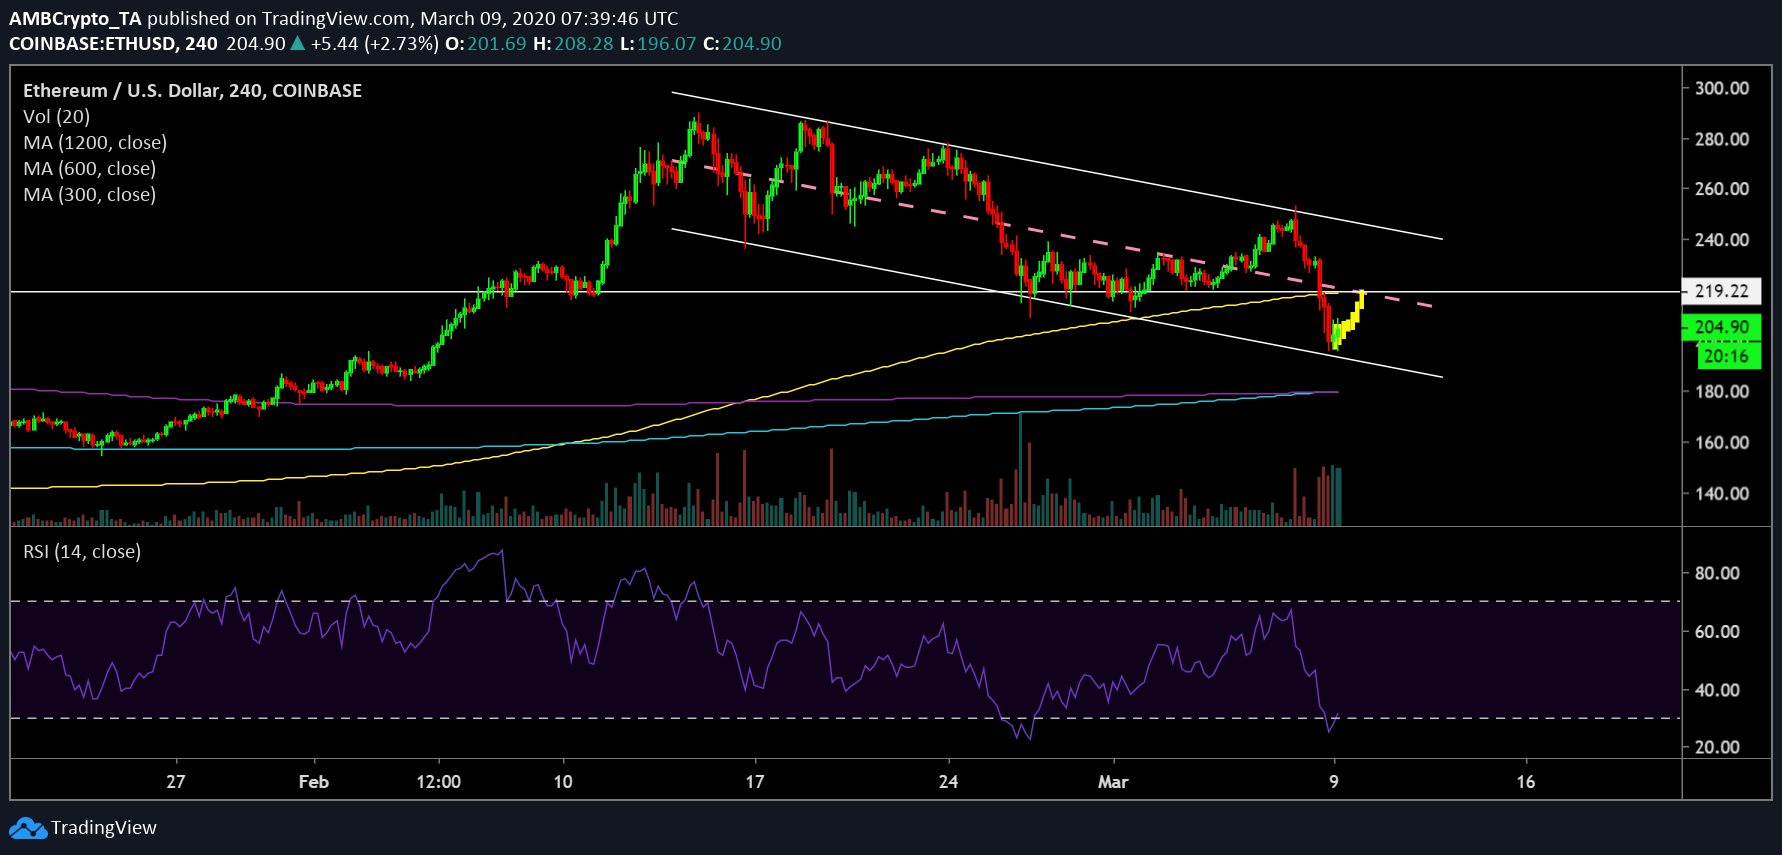
Source: ETH/USD on TradingView
While Ethereum appeared in the bearish zone, there could be a potential reversal in trend here. The price candles oscillated between a descending parallel channel, a trend that has been continuing since 16th February. The formation of a descending channel pattern indicated a bullish break for the coin despite the tumble.
RSI indicator also hinted at a bullish revival for the coin in the near future and a trend reversal after it climbed above the oversold zone.
Confluence of Resistance
Interestingly, the level of $219 has been crucial for Ethereum’s price. From August 2019 to the first week of February 2020, this acted as a major resistance level. Ethereum regained control, following the bullish momentum in February, and broke this level soon after.
However, the latest downward spiral enabled it to breach this level and fall significantly below as it acts as a resistance point now.
Further validating the presence of this crucial resistance was the 50-day moving average, which was also close to this point at $219, as well the center-line of the descending channel where the candles have sustained severe downward pressure.
If the bullish trend persists, this could drive Ethereum’s value to the $219 level, meaning a surge of 11.33%.
Correlation
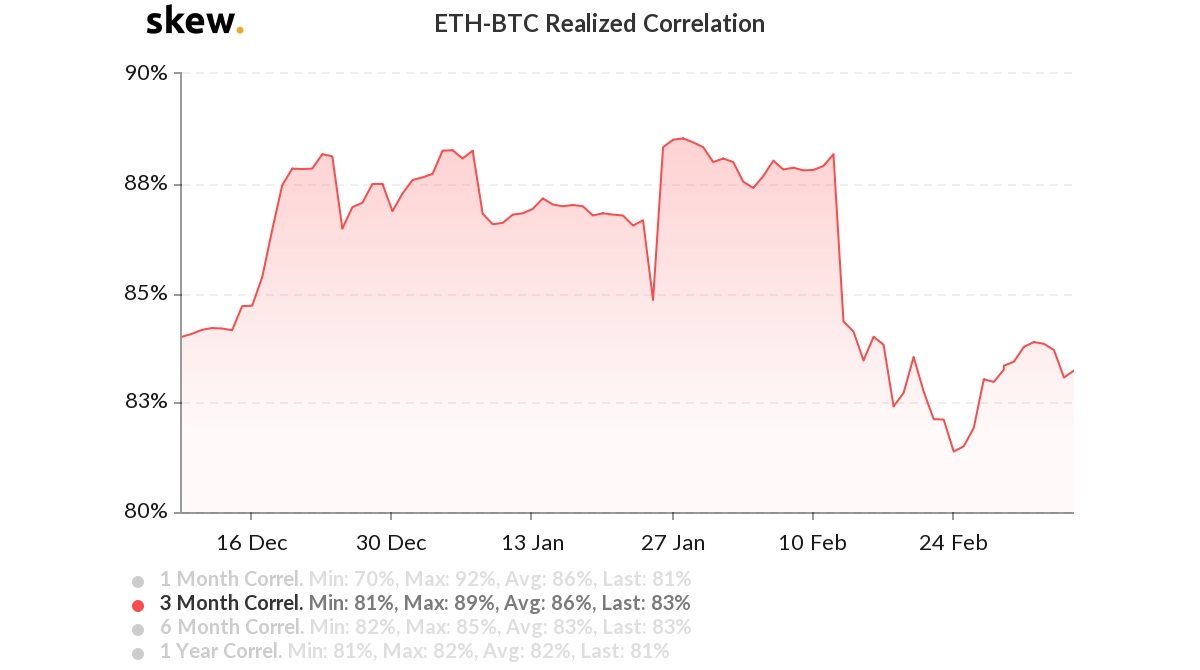
Source: Skew
This decline in Ethereum’s price was propelled by Bitcoin’s price that took a massive plunge on 8th March. The prices of cryptocurrencies such as Ethereum have seen a high degree of correlation with the king coin. According to Skew charts, the correlation for ETH-BTC stood at a whopping 83%.
According to Skew’s previous research, ETH has been the highest correlated cryptocurrency to Bitcoin for two years running. The average correlation coefficient was noted to be 0.9.
Conclusion
Ethereum fell below major support levels following the bearish momentum. However, the indicators suggested a trend reversal and a potential price rise. The coin found a major resistance point at $219. The 100-day moving average slowly moved above that of the 200-day moving average. This further suggested bullish revival for the coin’s price as its price was supported by the 200-day moving average as well as the 100-day moving average.