Ethereum to record more corrections, before ascending above $200

Ethereum’s recent encounter with the bulls enabled the world’s 2nd largest crypto-asset to breach its key resistance at $155 for the first time since the end of November 2019. The registered growth since 14 January is effectively upwards of 20 percent, as the valuation stretched from $143.73 to $174.37 in a span of just 3 days.
At press time, Ethereum was priced at $168.47, with a market capitalization of $18.5 billion. Over the past 24 hours, however, ETH had recorded a minor slump of -0.74 percent.
1-hour chart

Source: ETH/USD on TradingView
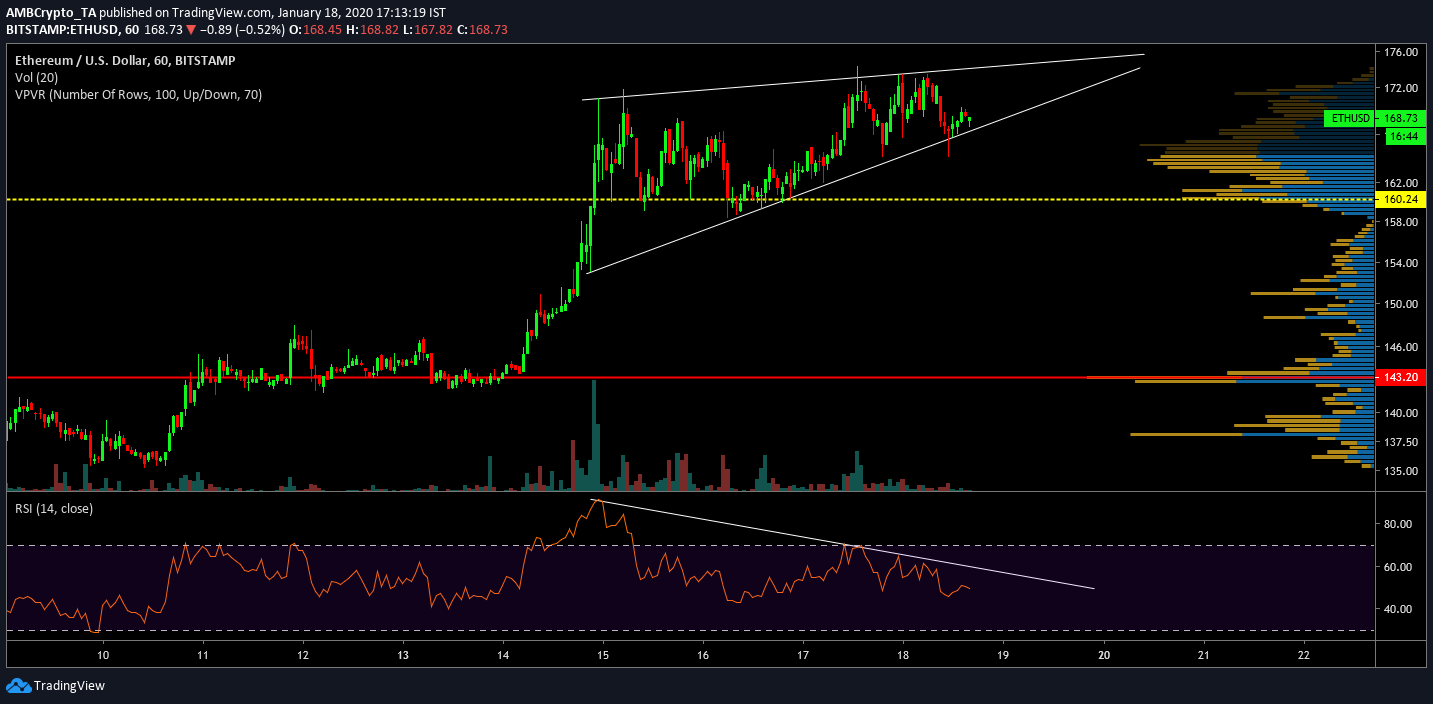
The 1-hour chart for Ethereum pictured the gradual growth in price over the past one week. After the massive surge on the 14th, the token exhibited a rising wedge pattern over the next three days. The pattern suggested that the possibility of a bearish pullback is high over the next few days for Ethereum. The upper trend line and lower trend line were both tested more than three times, suggesting that a breakout is imminent.
According to the VPVR indicator, the trading volume between the range $161 to $165 has been high over the past few days, validating the key support line at $160.24. A breach below the support line could trigger a heavy slump in valuation.
The RSI indicator has also declined since 14 January, exhibiting a bearish diversion with the price, something that confirms the aforementioned wedge pattern.
1-day chart

Source: ETH/USD on TradingView
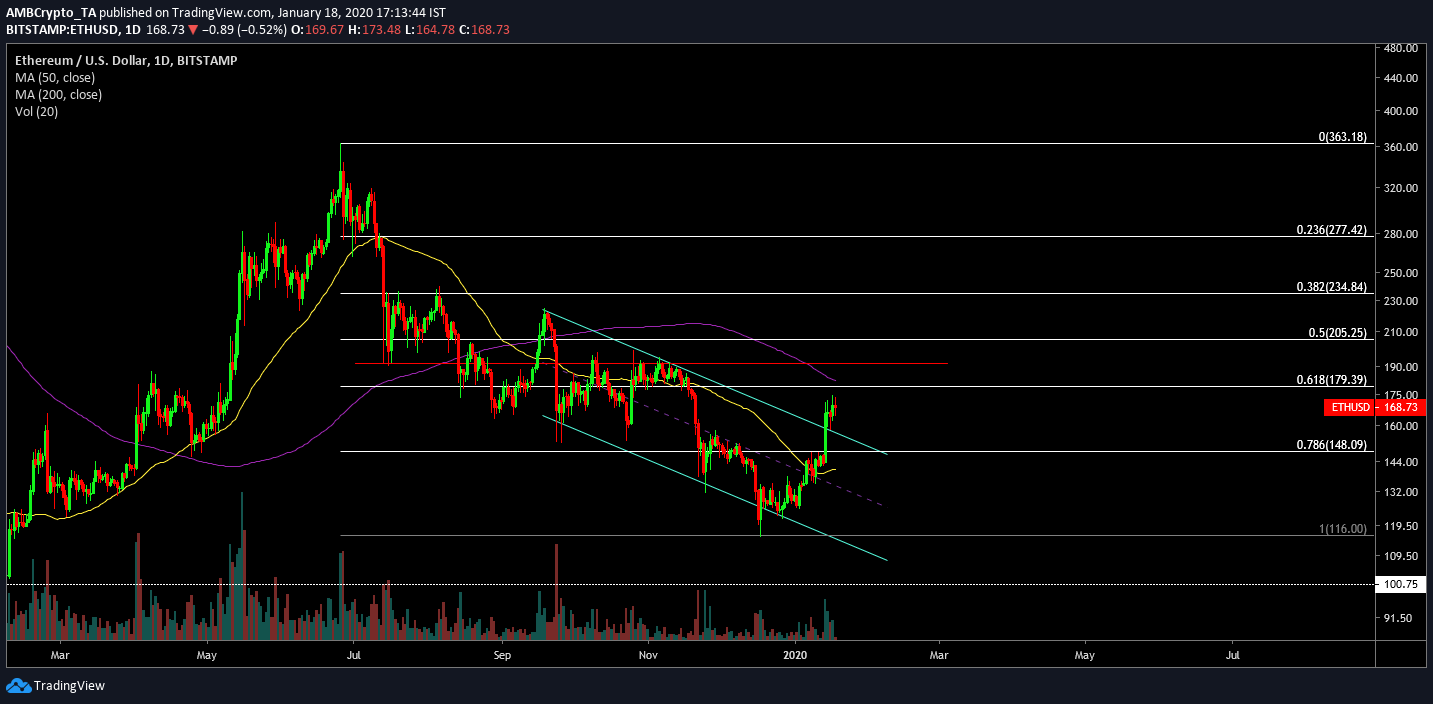
The long-term chart for Ethreum registered a bullish breach of the descending channel on 14 January. However, on close observation, it was found that the 200-Moving Average has been acting as strong resistance since early August 2019. The strong position of the Moving Average as a key resistance is most likely to follow over the new few days. In case the price moves above the Moving Average, a strong resistance line at $191.25 needs to be tested, before the valuation can approach its psychological resistance at $200.
The Fibonacci retracement lines exhibited similar resistance levels for ETH, stretching the immediate resistance for the token at $179.39 and $205.25.
Conclusion
The chances of a pullback are very high for Ethereum, at the moment. However, a price correction remains a positive development for the market as ETH may breach the $200 mark over the next few weeks.


