Analysis
Ethereum to cross $200 after potential breakout from pennant late-November

Ethereum has been moving around the $185 valuation mark for the past couple of weeks. While this undoubtedly isn’t the highest ETH has been valued at, it is certainly a far cry from 2019’s current low of around $100, and isn’t too far off from last October’s value of around $205. Touting a $190 price-tag at the time of writing, ETH has a market cap of almost $20.7 billion, with a daily trading volume of over $11 billion. ETH also saw a 1.21% rise in value over the last 24 hours, according to CoinMarketCap.
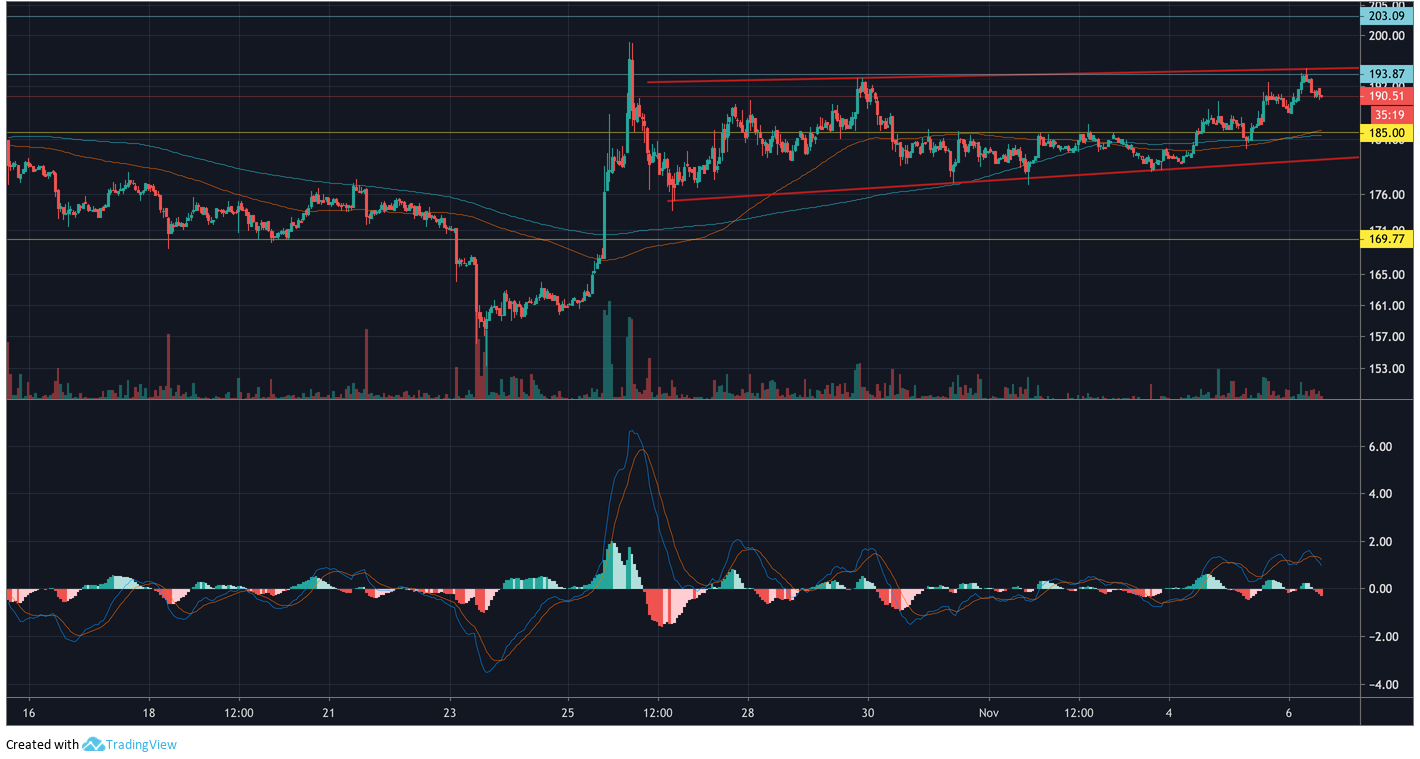
Ethereum 1-hour chart

Source: ETHUSD on TradingView
From the hourly chart, it looks as though ETH entered into a pennant pattern toward the end of last month, zig-zagging between the two trend-lines since then. The volumes over this period also look to be following a decreasing trend, which is the case for 89% of pennant patterns. MACD shows that a bearish crossover took place recently, with the signal line moving above the MACD line between the 0.0 and 2.0 marks. This indicates that the price of ETH may move down in the short-term. The 100 and 200-moving averages, however, paint a different picture.
As both indicator lines appear to be moving under the price line, with the 200 MA below the 100 MA, this could be a sign of a near-future bullish movement. If the price moves up, it will have to test the $193.87 resistance before testing the upper pattern boundary. Pennants tend to breakout upwards 57% of the time, so it is statistically more likely that ETH will move up in the coming weeks. If the price does move down, ETH could fall down to $172 in the next couple of weeks.
ETH will likely bounce from the upper boundary by next week, and continue along the pattern until the end of the month when it will probably break out upwards to above $200.

