Ethereum starts to rally post Bitcoin halving: Key insights

- ETH has risen 6% since the halving day.
- The total number of accounts longing ETH on Binance rose since halving.
Bitcoin [BTC] halving seemed to have exerted significant upward pressure on Ethereum [ETH].
The second-largest cryptocurrency rose 6% since the halving day, exchanging hands at $3,250 at the time of writing, data from CoinMarketCap showed.
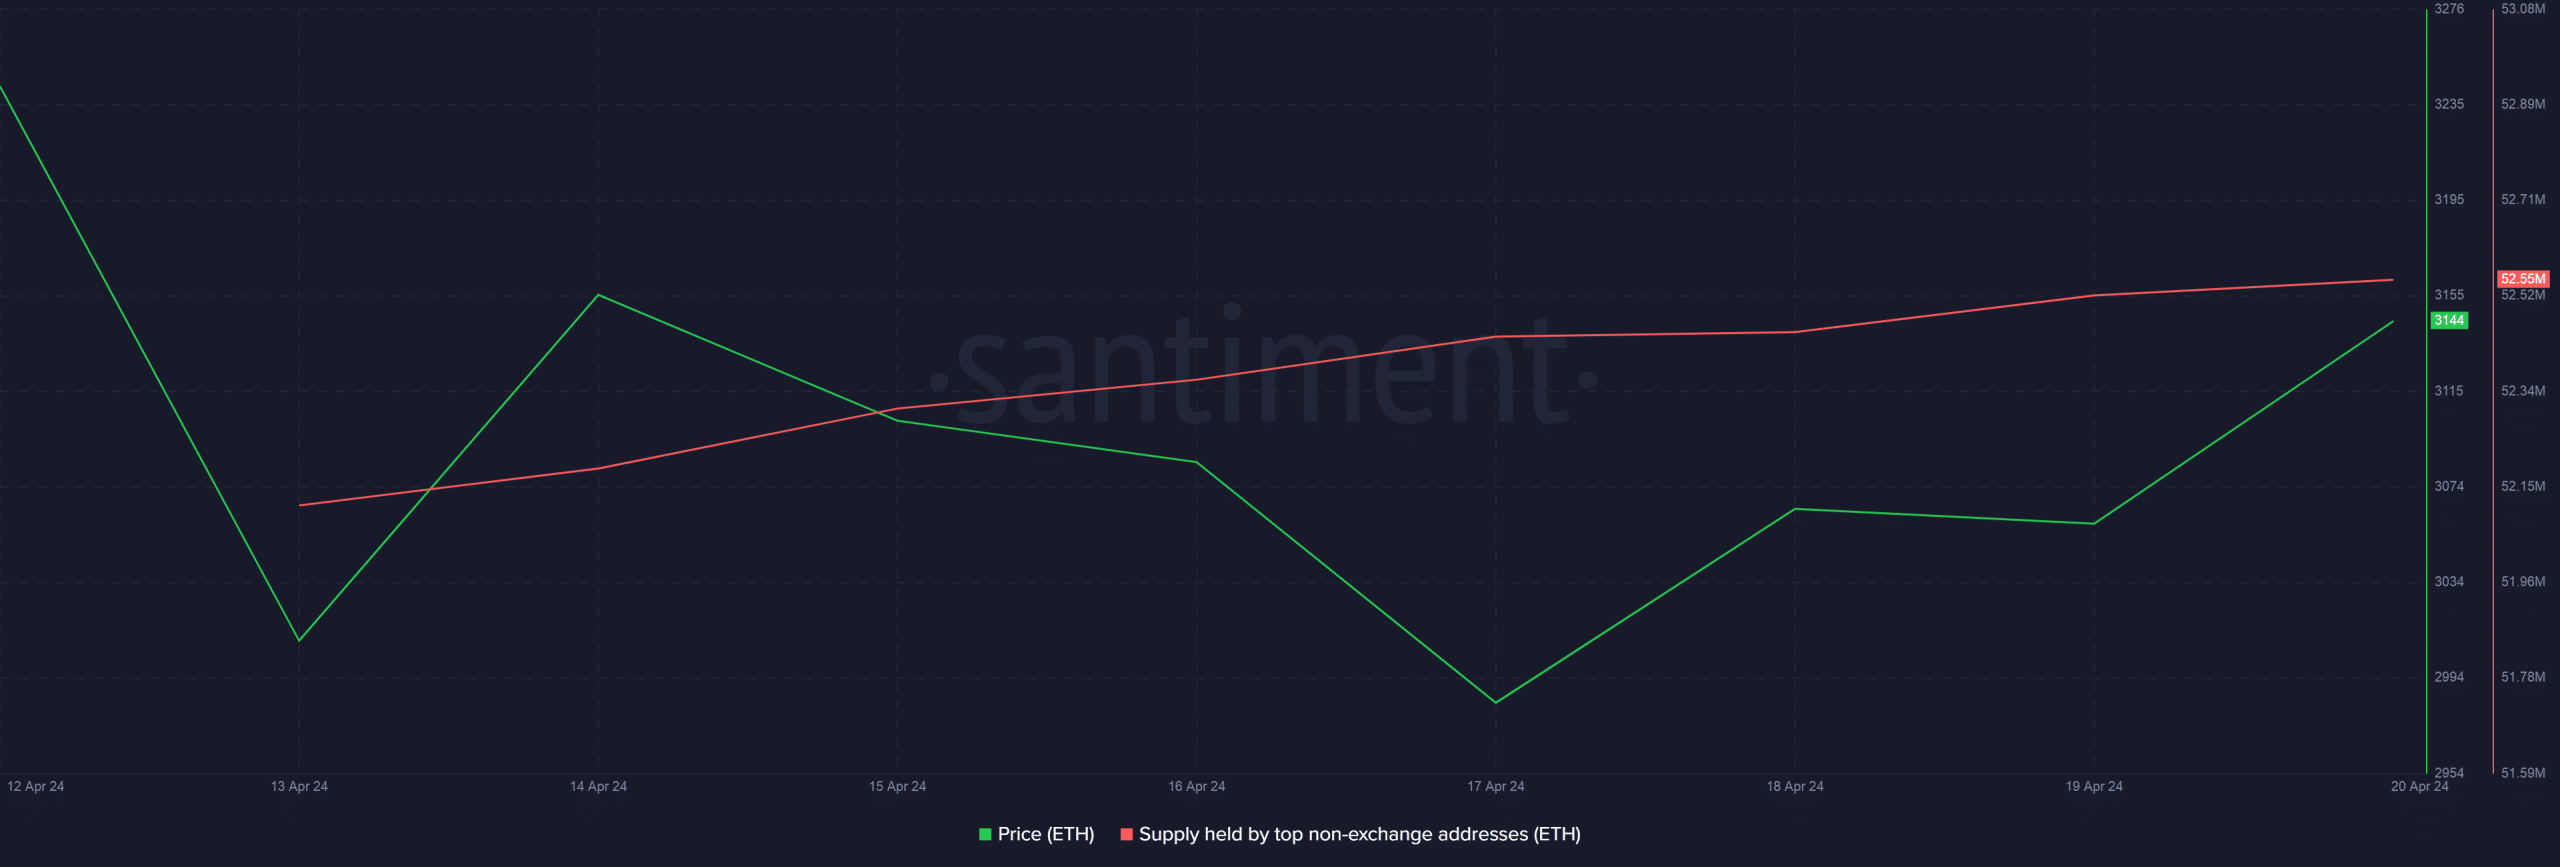
Using Santiment, AMBCrypto noted a slight increase in the total balance of top non-exchange addresses since halving. This suggested that accumulation by influential investors supported the price rise.
Will the momentum sustain?
According to prominent crypto market analyst Ali Martinez, $3,170 till $3.270 has acted as a strong resistance for ETH, with as many as 1.63 million addresses acquiring 4.45 million coins in this range.
While ETH clearly broke the first barrier, a break above $3.270 would support the idea of a rally all the way to $3,650, Martinez predicted.
Futures traders bet on ETH’s rise
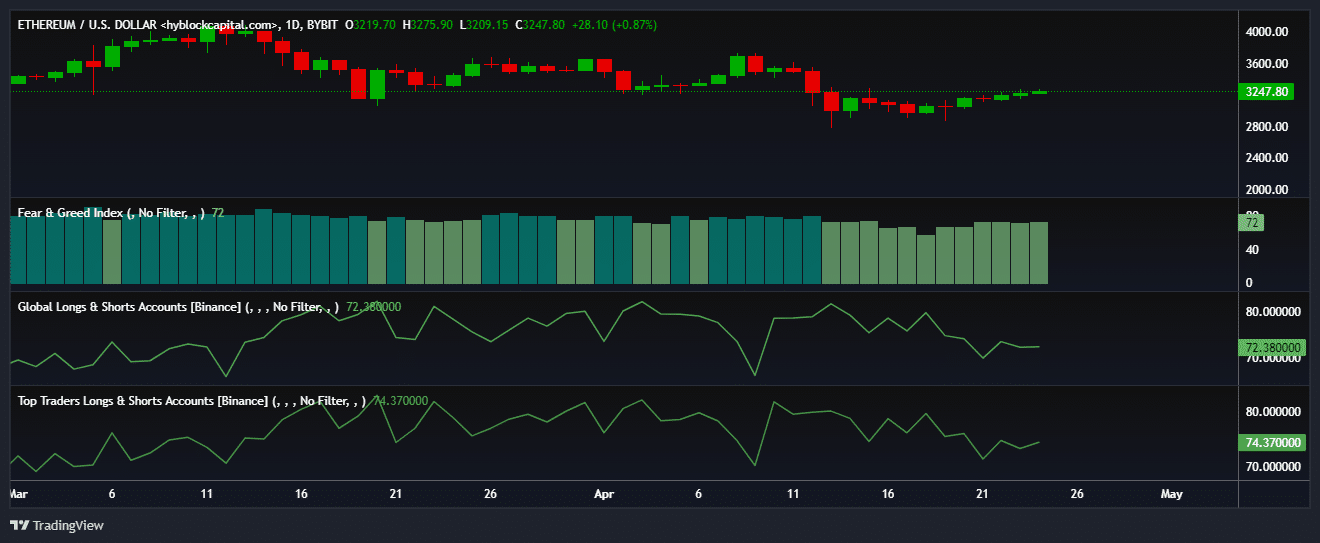
The price rally also galvanized ETH’s futures market. Since the 20th of April, the total number of accounts longing ETH on Binance have risen steadily, AMBCrypto noticed using Hyblock Capital’s data.
Additionally, the percentage of whale accounts taking bullish bets for ETH increased from 71% to 74% since halving. This sort of justified the accumulation theory outlined earlier.
The market sentiment also tilted towards greed, which could increase buying pressure in the coming days.
What do the technical indicators say?
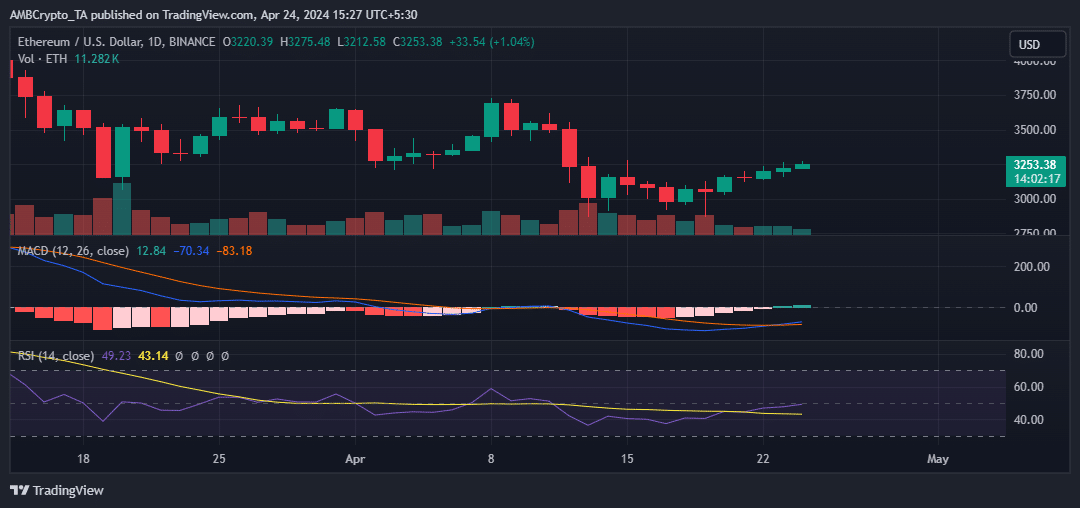
AMBCrypto examined ETH’s daily chart and its key technical indicators to gauge the next movements.
The Relative Strength Index (RSI) hit the neutral 50 level as of this writing, indicating a pivot towards the bullish side. Typically, the 40-50 zone acts as a good support during a bull market.
Hence, a sharp move above this area could support a sustained rally.
Is your portfolio green? Check out the ETH Profit Calculator
The Moving Average Convergence Divergence (MACD) crossed above the signal line, indicating the possibility of a price increase.
However, to strengthen the bullish narrative, the MACD should cross above 0 in the days to come.


