Ethereum
Ethereum short-term Price Analysis: 07 August

Disclaimer: The following article attempts to analyze the short-term Ethereum market and its impact on price.
The cryptocurrency market has been witnessing bursts of volatility over the past week. As the largest cryptocurrency, Bitcoin rallied, the remaining market also marched along, however, this trend was only limited to major cryptos, as the correlation between BTC and small-cap weakened. Whereas, Ethereum, the second-largest crypto has also been noticing its correlation weaken with Bitcoin as it begins an independent journey.
At press time, Etheruem’s market value was at $394, as it trended lower over the past couple of days. The market capitalization of Ethereum was $44.26 billion, whereas the 24-hour trading volume remained $11.15 billion.

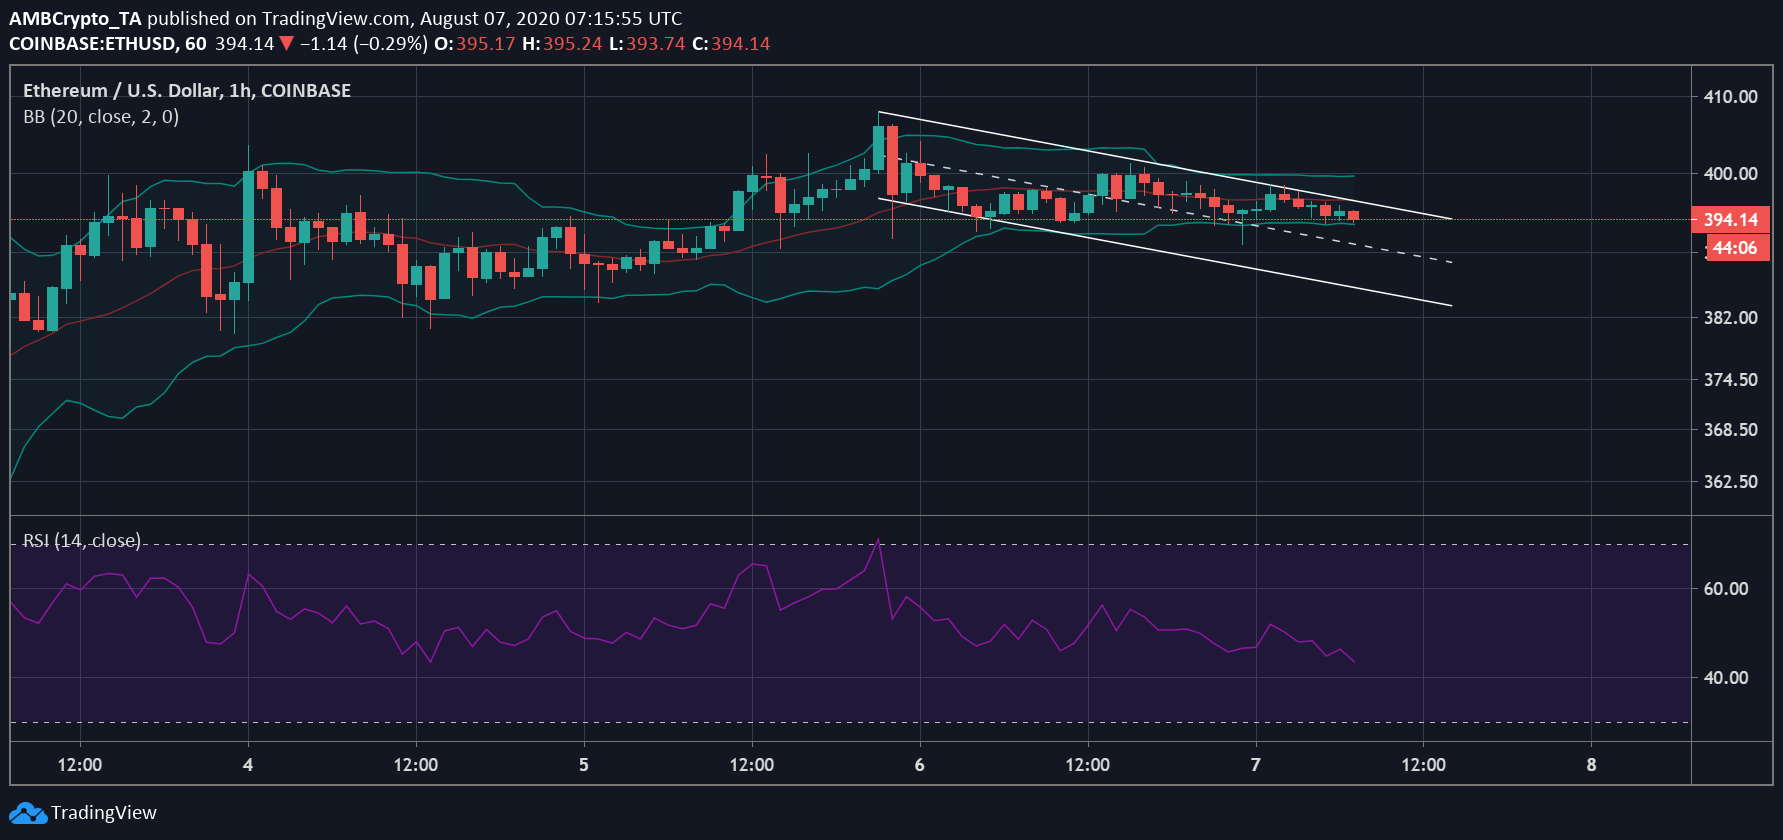
Source: ETH/USD on TradingView
As per the daily chart of ETH, the decreasing price of the asset was forming a part of a descending channel. The channel marked Ethereum’s lower highs and lower lows and was a bullish pattern. As the price trend lowers further along the channel, it may witness a strong upwards boost to the price as the asset breaches the pattern. The volatility in the market has also been low, as indicated by the Bollinger Bands converging.
Whereas the signal line was aligned above the candlesticks in the past few hours, highlighting the current bearish pressure experienced in the market. Similarly, the Relative Strength Index [RSI] also was at equilibrium, noting that the buying and the selling pressures had evened, at press time.
Source: ETH/USD on TradingView
As the coin has been facing a downwards pressure, the current price has been at the support line marked by the Fib Retracement tool at $394.04. If the coin did not manage to bounce back from this point and trended even lower, the next support was at $378.33. As the volatility in the market remained low, the coin might be able to break out of the pattern soon, but the upward resistance is at $415.

