Ethereum short-term Price Analysis: 25 September

Disclaimer: The following article attempts to analyze the emerging pattern in the Ethereum short-term market and its impact on price.
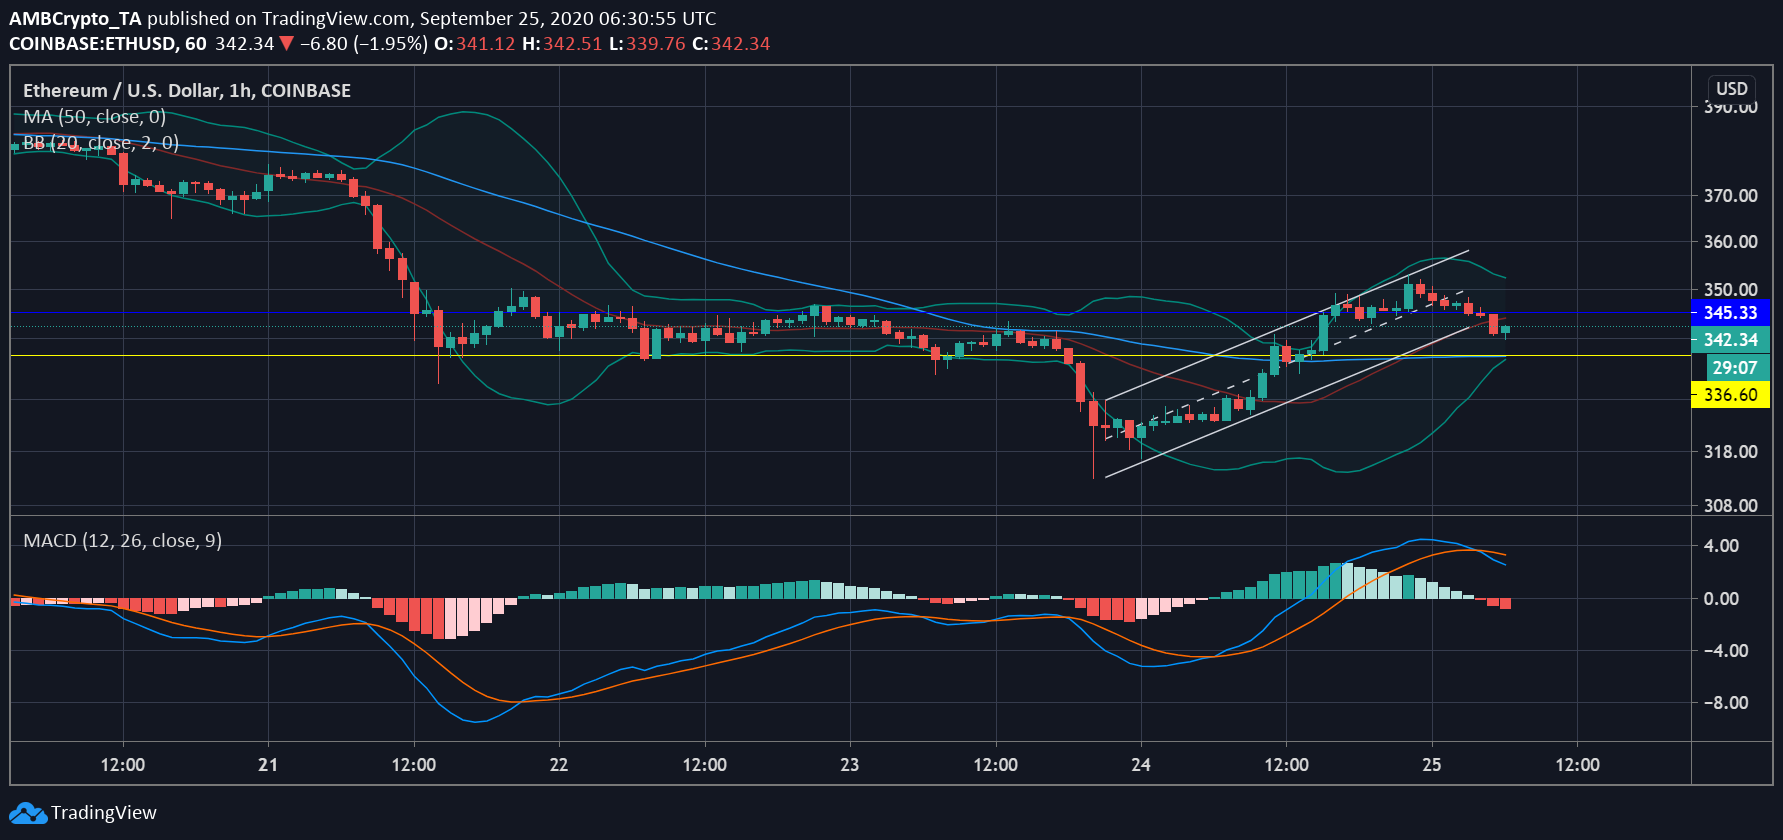
Another push to the upside boosted Ethereum’s price by 9% on 24 September. This spike in the price had managed to surpass its resistance at $345.33 and be valued at $353.14. However, the price immediately corrected itself as it began tumbling and finds itself now at $344.08, right under the resistance.

Source: ETH/USD on TradingView
According to the above chart, the surge in price formed into an ascending channel but has been deviating from the pattern as correction set in. The Bollinger Bands have been indicating that this sudden rally has caused the volatility to also rise. While the indicator is suggesting bearishness in the market due to the current correcting price.
Whereas the MACD indicator has been indicating a growing momentum of sellers. The signal line has taken over the MACD line and has also been signaling at a bearish market.

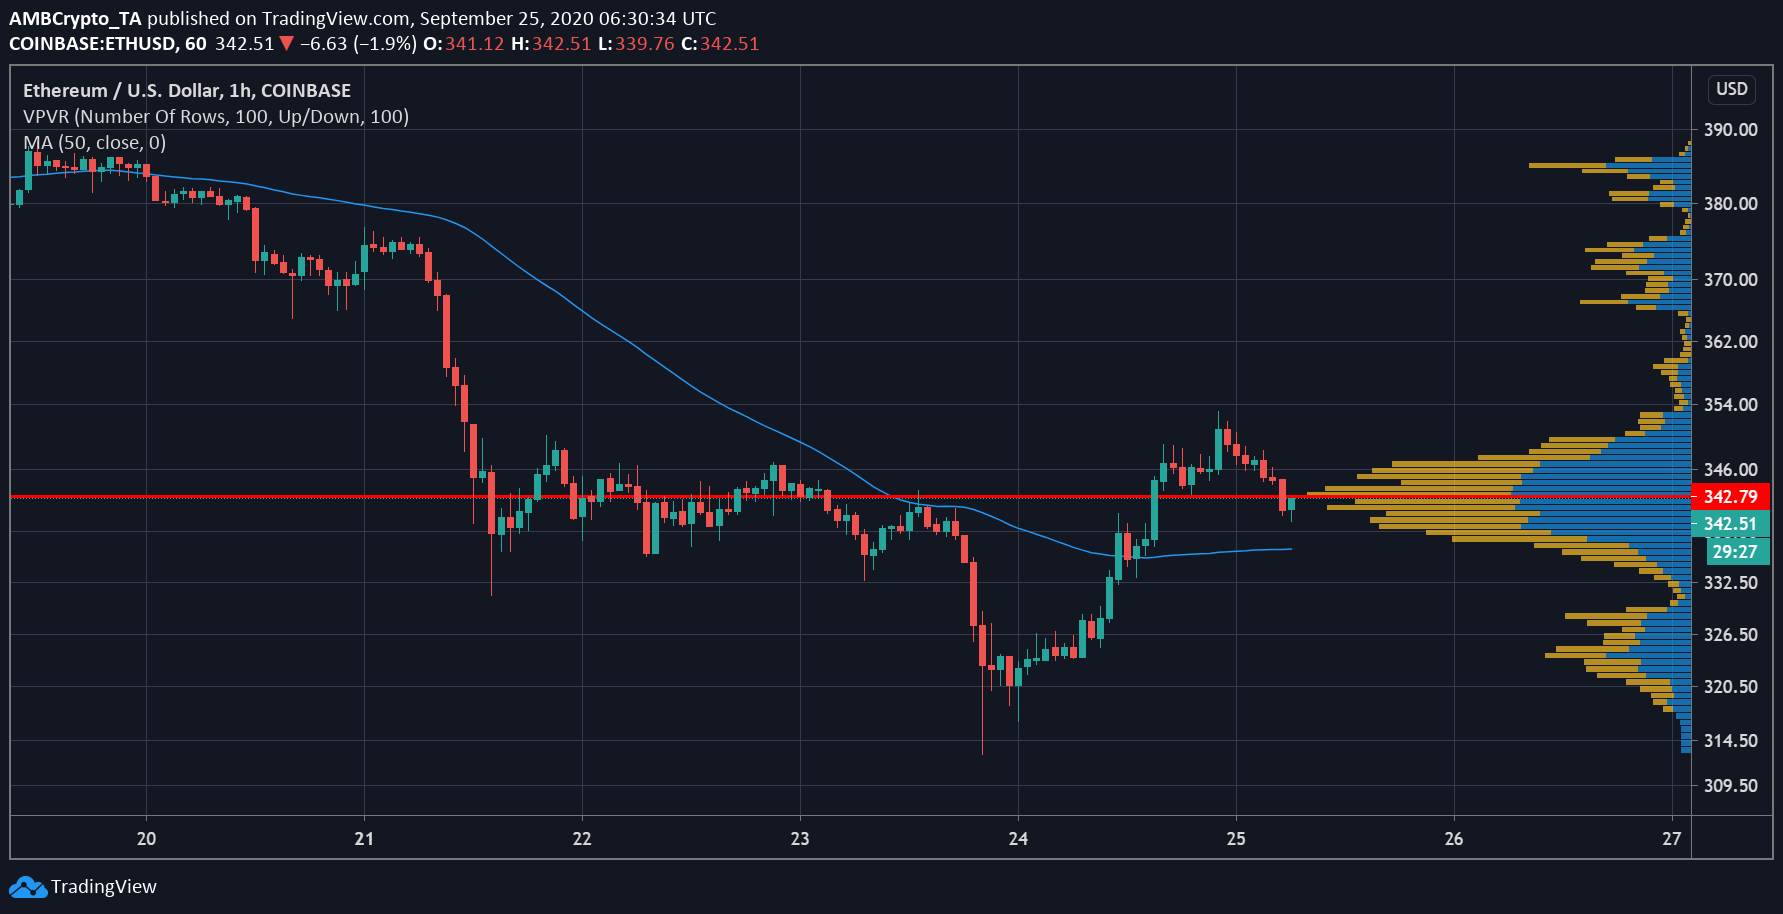
Source: ETH/USD on TradingView
The Visible range shows the Point of Control [PoC] at $342.98 as it was a high traded price level in this period. The next high volume price node was at $341, which will act as strong support and the price has tested this level. The moving average has also moved under the price bars, which indicates the price swing has changed to move upwards, but the bearishness has remained in the market.
The upcoming expiry will decide the fate of the ETH market, with high volatility the swing in its price will be something traders will be waiting to capitalize on.
