Ethereum short-term Price Analysis: 16 October

Disclaimer: The findings of the following article attempt to analyze the emerging patterns in the Ethereum short-term market and its impact on the price.
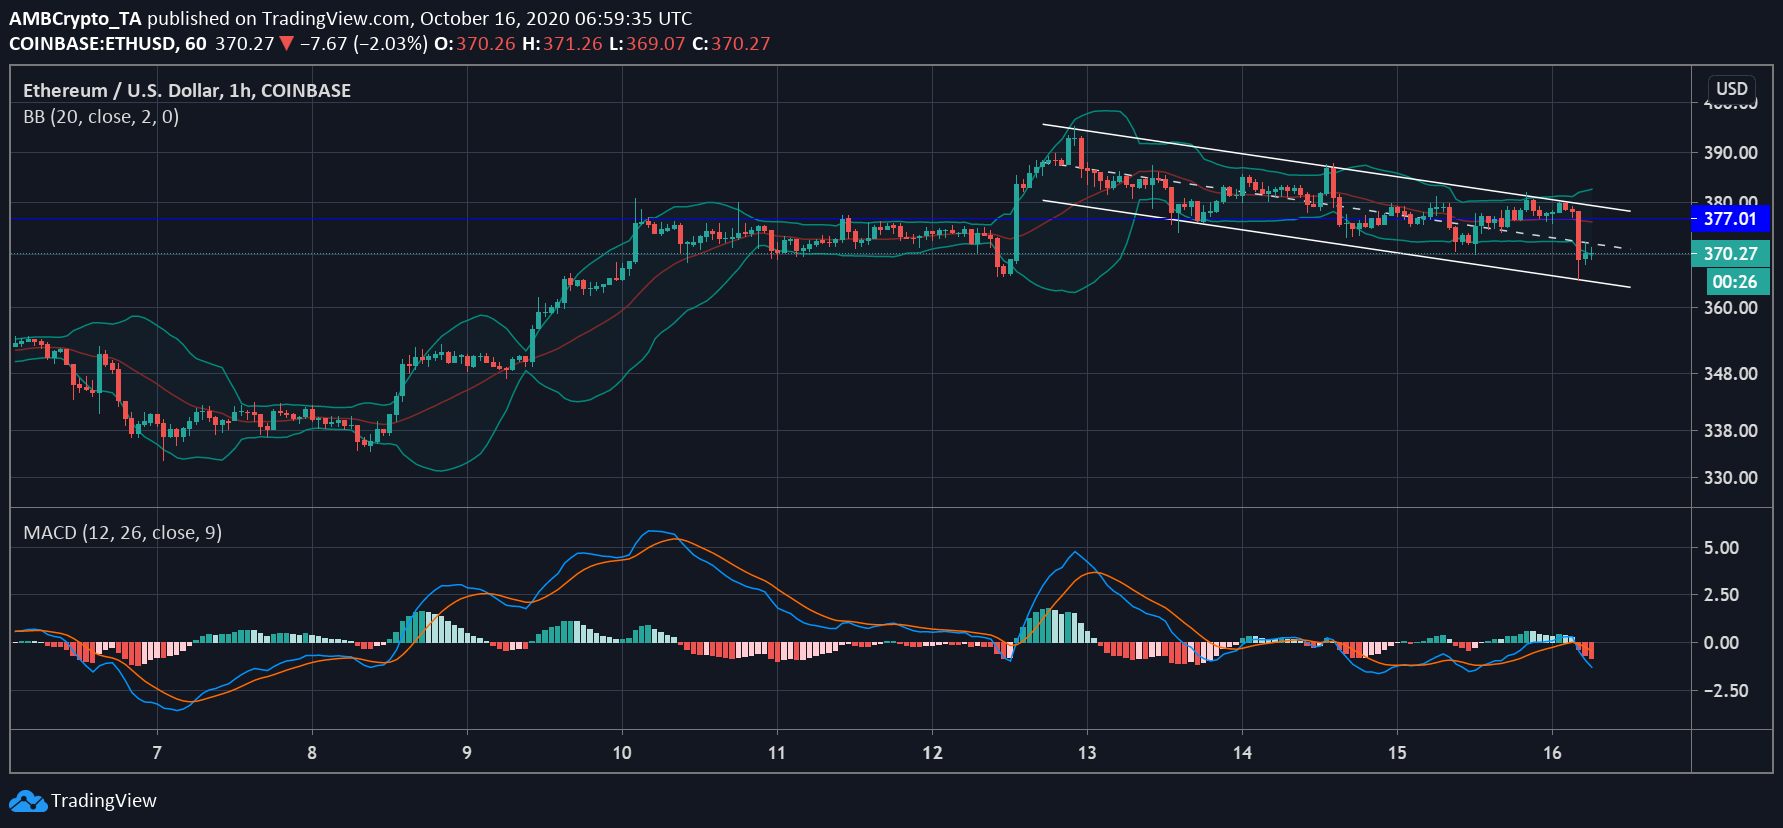
The sudden surge in the price concluded on 13 October, as Ethereum’s price has been descending since. As the price appreciated there have been some bumps in the way downwards that accelerated its fall. Earlier in the day, one such bump caused ETH’s price to sink through the support at $371 and was currently trading at $370.

Source: ETH/USD on TradingView
The short-term chart of Ethereum has been noting this downward trending price and it has been restricted within a descending channel, pushing its value further down. The sudden fall in the price could also be a result of OKEx unexpectedly suspending withdrawals on the same day. However, this fall caused the volatility in the market to surge as indicated by the widening of the Bollinger Bands.
Whereas the signal line has crossed over the price bars and has been indicating the bearish pressure in the market for quite a while. In the short term, the ETH price will be pushed lower. The MACD indicator noted that there was a willing pressure in the market as the bars turned to the negative zone and the bars are increasingly negative, this meant the selling pressure was gaining weight.

Source: ETH/USD on TradingView
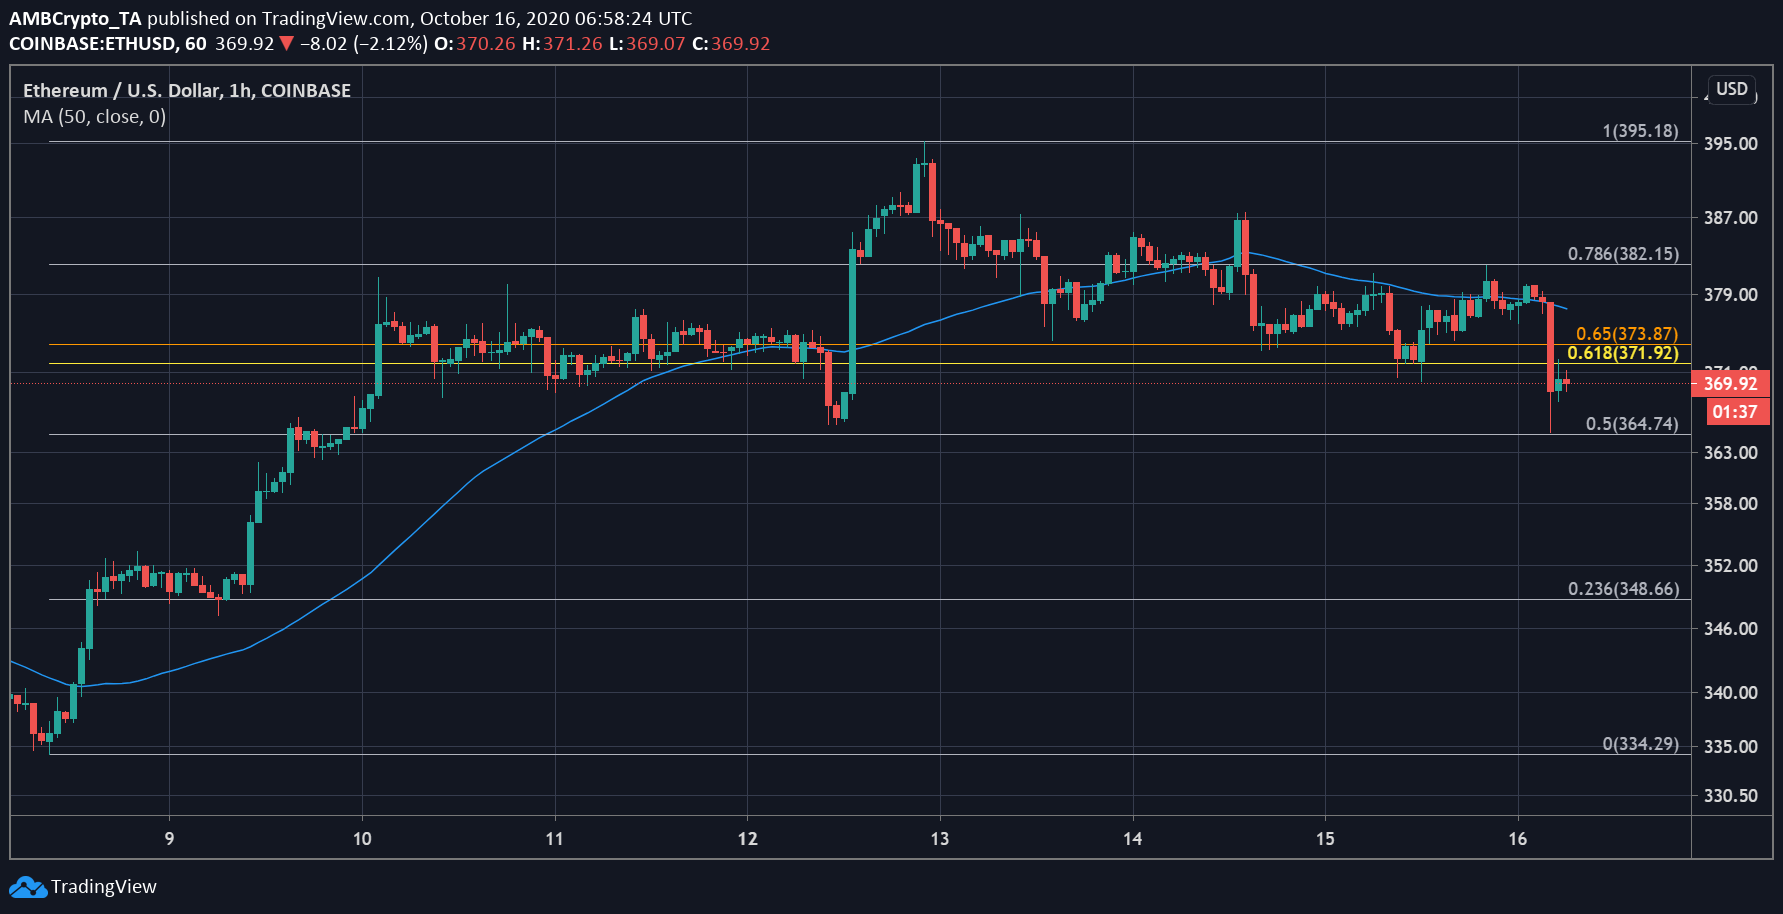
The above Fibonacci Retracement tool highlighted the most traded range for ETH’s price in the given period. It has mostly traded between $369 and $377. However, the price has been wavering for the past few days and resulted in ETH breaching its support at $371.92, as this level becomes a resistance going forward. The 50 Moving Average remained well- above the price bars, noting the price trend has changed and remained low.
The price of ETH may bounce back in its range of $373-$371 soon, but it may need another boost to rise from here.
