Ethereum short-term Price Analysis: 14 September

Disclaimer: The findings of the following article attempt to assess Ethereum’s price trends and the direction of it in the near-term
With the DeFi bubble cooling off, the situation has started to go sideways again. The prices of Ethereum and even Bitcoin are now moving within certain ranges, a development that is good for scalping. In fact, while Ethereum broke out of a falling wedge recently, it was soon stopped by the bulls.
With ETH noting a price depreciation of over 5.4% on the charts over the last 24 hours, the cryptocurrency’s weekly gains are now close to being wiped out entirely.
Ethereum 1-hour chart

Source: ETHUSDT on TradingView
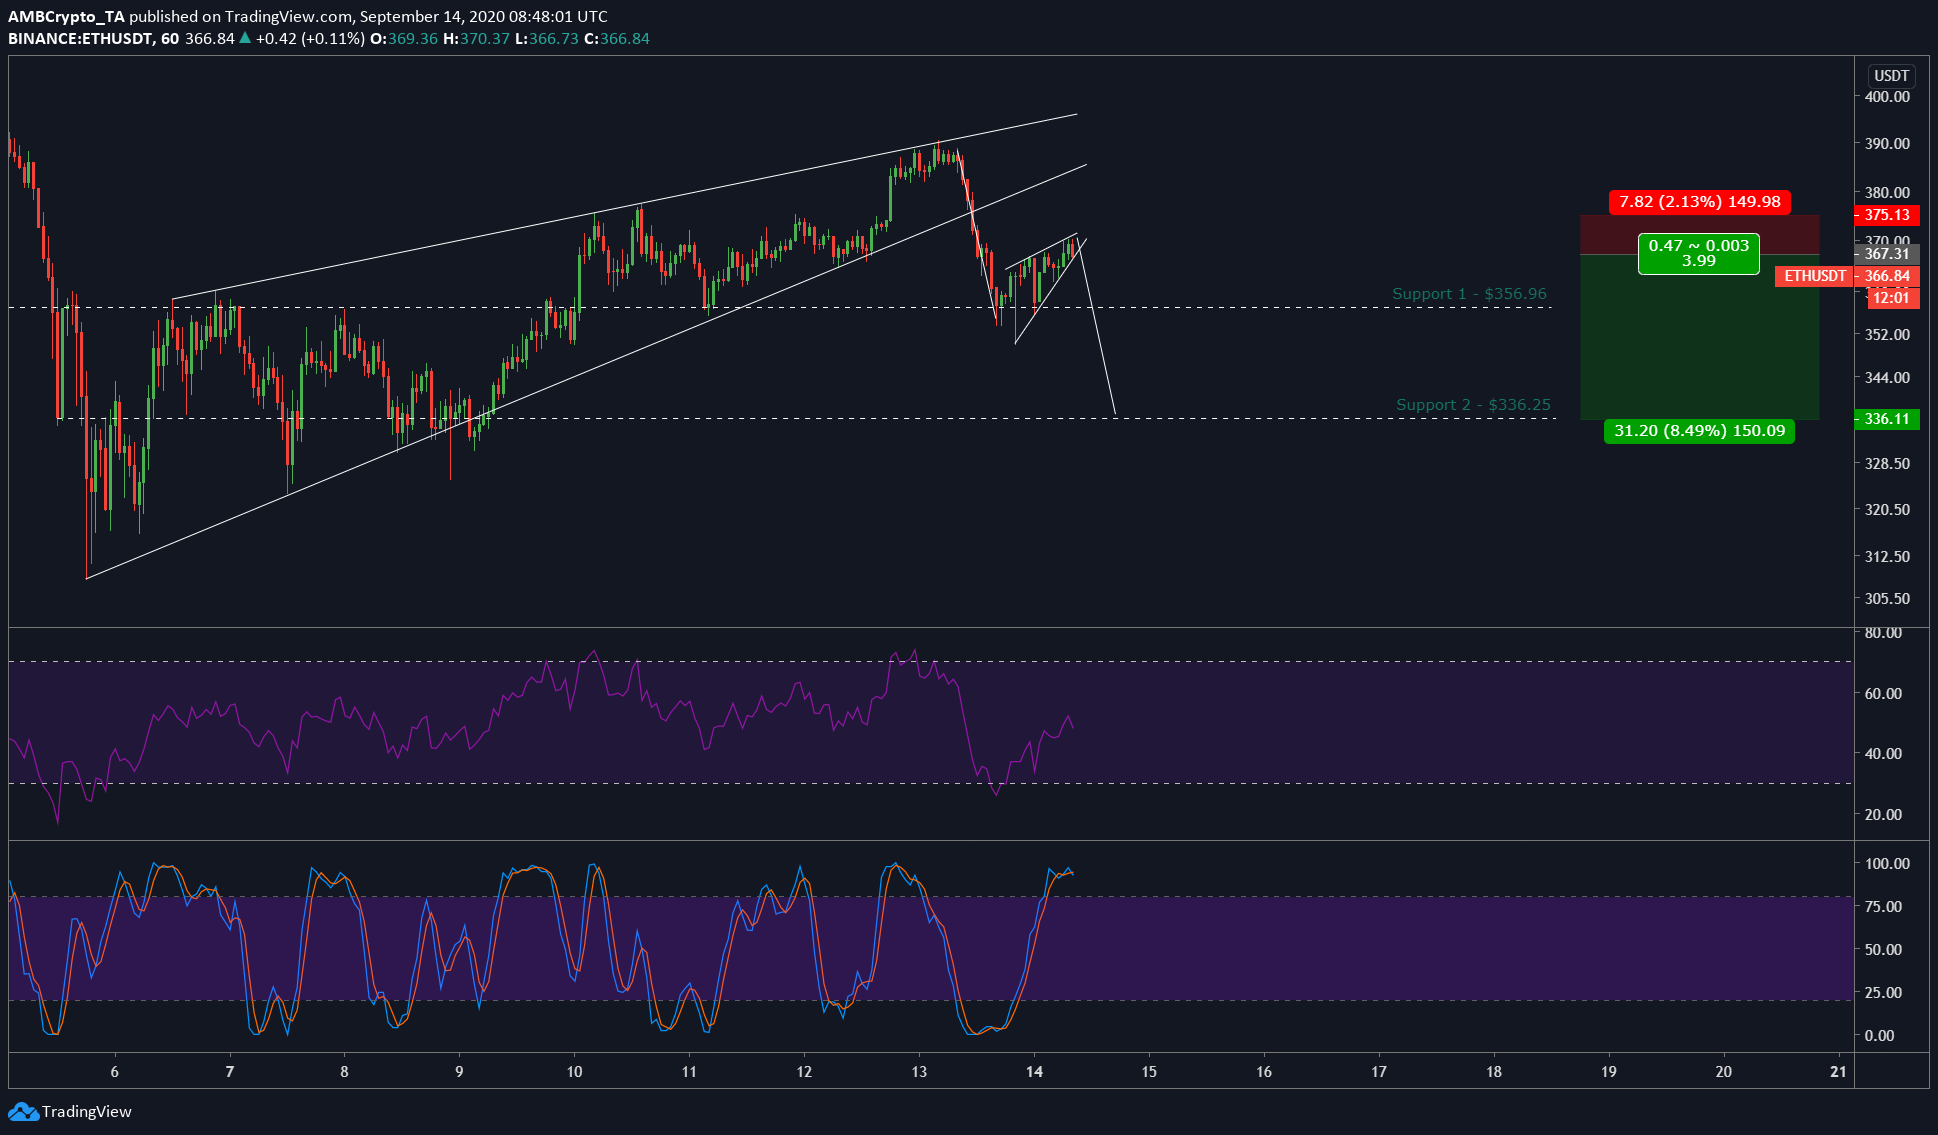
From the attached chart, we can see that ETH’s price has broken out of the larger falling wedge. However, the price hadn’t hit target 2 yet. This intermediate surge could be the bulls attempting to revive the cryptocurrency’s price. However, it only turned out to be a pit stop for the bears, before they continued their clobbering.
The consolidation turned upside, forming a pennant/rising wedge, which when looked at with the previous price pattern, formed a continuation pattern. Hence, the targets for the price include $356.96, which was 2.83% away from the entry point [$367.31], at press time.
Stop-loss can be set up at $375.13, which was 2.13% away from the entry point. The take-profit level can be at two points, the first at $356.96 which would yield an R of 1.32. Alternatively, one could wait for the price to drop all the way down to the next strong support level at $336.25, which is a drop of 8.49% from the entry point. This would provide an R of 3.99.
The interesting fact about the second target is that it is the 61.8%-Fib level. Also, to be on the safe side, one could take part in the profits at $346.33, which is the 0.5-Fib level. This trade would provide an R of 2.68.
It should also be noted that if the price of ETH on a shorter timeframe changes, the rising wedge could turn into a channel too.


