
Disclaimer: The findings of the following analysis should materialize over the next 24 hours
The top cryptocurrencies have been following the price trends in the Bitcoin market, however, with a price consolidation taking place in the BTC market, other alts have also been witnessing a reduced movement. The price of Ethereum recently saw a sudden sell-off as the price of the asset hit $247, providing an opportunity for traders to short the coin. As the price collapsed to $237, the price once again started building up.
At press time, ETH was being traded at $238.57 with a market cap of $26.72 billion. The price has been around strong resistance and has been experiencing constant push and pull.
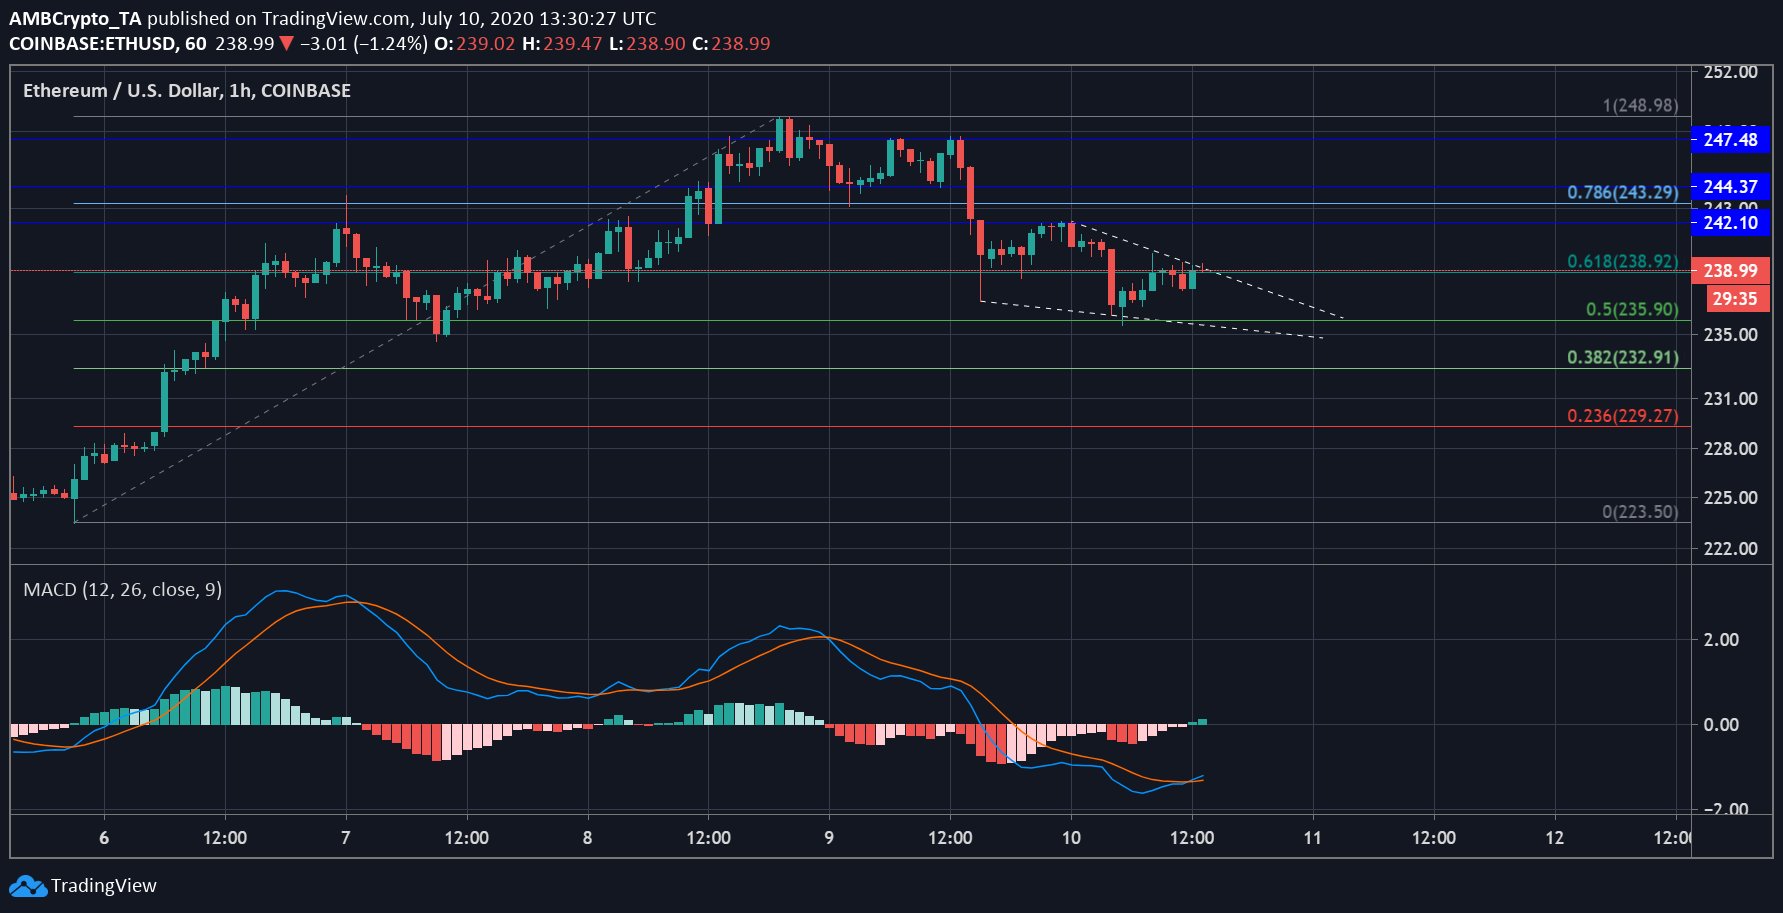
Source: ETH/USD on TradingView
Looking at the short-term, 1-hour chart of Ethereum, the coin has been moving again in an uptrend. According to the chart, the price of ETH has been moving in a falling wedge pattern which has been traditionally considered as a bullish pattern. It started from the price point of $242.10, since then it has been plunging and formed a cone towards the current price. The lower trend line has been also marking lower lows starting from $237.04.
According to the Fib Retracement tool, the immediate resistance faced by the coin was at $238,92, its current price level. If ETH manages to move past this resistance, the next level was marked higher at $243.92, but could easily move past it and reach $248.98. As the bullish pattern takes shape, a rise in price could be visible sooner than expected. The indicator MACD, also pointed at this bullishness entering the market.
At press time, the MACD line had crossed over the signal line. With the recent cross over, the market indicated a rise in the buying behavior, however, the momentum for the price action has been very low and a reversal of trend can be possible. Even though falling wedges is considered a bullish chart formation, it can indicate both reversal and continuation patterns, and with the current information provided by the indicator and tools, there was a possibility of a trend reversal.