Analysis
Ethereum short-term Price Analysis: 02 December
While Ethereum exhibited a massive drop below $500 on the 26th of November, a sharp recovery has brought back the asset above $600. While the price is currently hovering under the range, the short-term analysis indicated a rather uncertain trend.
Ethereum 1-hour chart


Source: ETH/USD on Trading View
On 24th November, Ethereum’s value topped at $623 but yesterday on 1st December, it attained a new high at $637. While the valuation has dropped by over $30 in the last 16 hours, the asset currently exhibits a symmetrical triangle formation. A symmetrical triangle may break either way on the short-term chart, but the 50-Moving Average continued to thrust underlying support.
Another positive takeaway from the above illustration is the linear drop in price and trading volumes. Any concurrent drop in these two factors may lead to a swift reversal in the upwards direction.
However, it is important to keep an eye on the 4-hour chart as well.
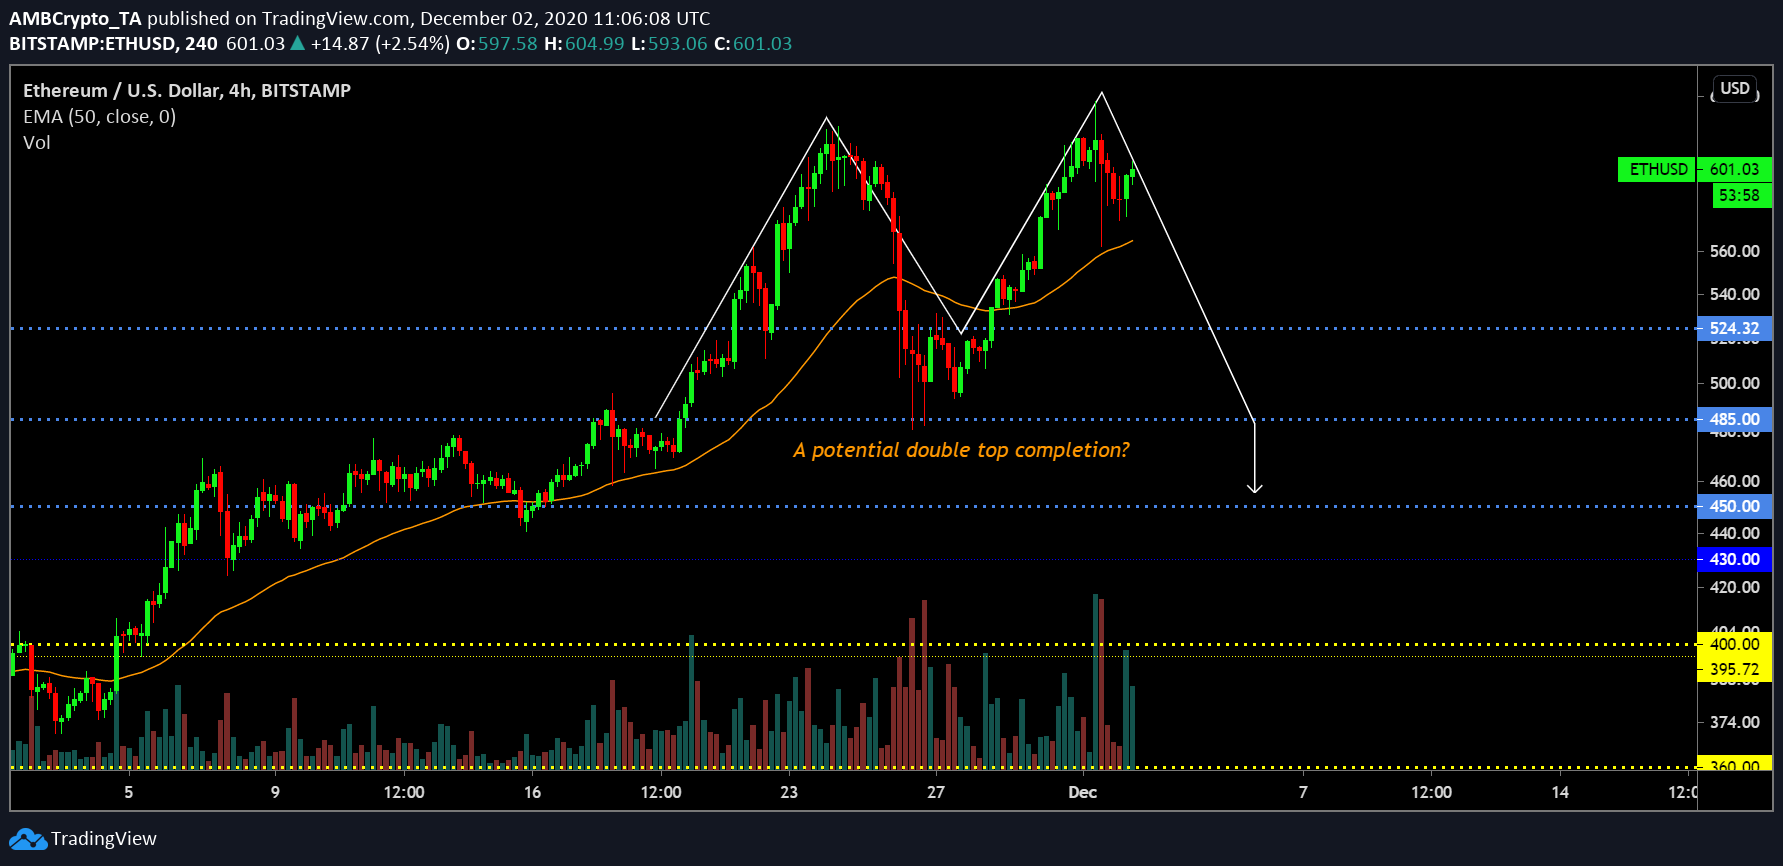
Source: ETH/USD on Trading View
Although a long-shot, the 4-hour chart may complete a double top pattern which the valuation re-tests support at $500 again. It would completely invalidate the MA and the price may attain a new low beyond $489 on 26th November.
Market Reasoning


Source: ETH/USD on Trading View
The market indicators are mostly neutral at press time. Relative Strength Index or RSI is hovering just under 50 rating and unsure of consistent buying or selling pressure. Awesome Oscillator is also completely neutral with a lack of any real momentum.
However, MACD exhibited a bullish outlook and with the trend completely flipped at press time.
Conclusion
While Ethereum may have undergone a pretty significant drop last week, it might not be the last one if the bears are able to enhance their grip. That said, bulls may have a say as well with the short-term trend equally matched at the moment.