Ethereum, Monero, Algorand Price Analysis: 28 October

If Ethereum (ETH) does trade above the $400 level again, altcoins further down the crypto ladder may also experience positive momentum given the largest altcoin’s high influence on market prices. However, at press time after noting a 0.3% decline since yesterday, ETH investors could only expect a minor retracement of gains over the next few days, with other altcoins also continuing to trade near their support levels.
Monero and Algorand were seen trading just above their support levels. The selling pressure and the ensuing bearishness also stalled any immediate price recovery attempts for the two digital assets.
Ethereum [ETH]

Source: ETH/USD on TradingView
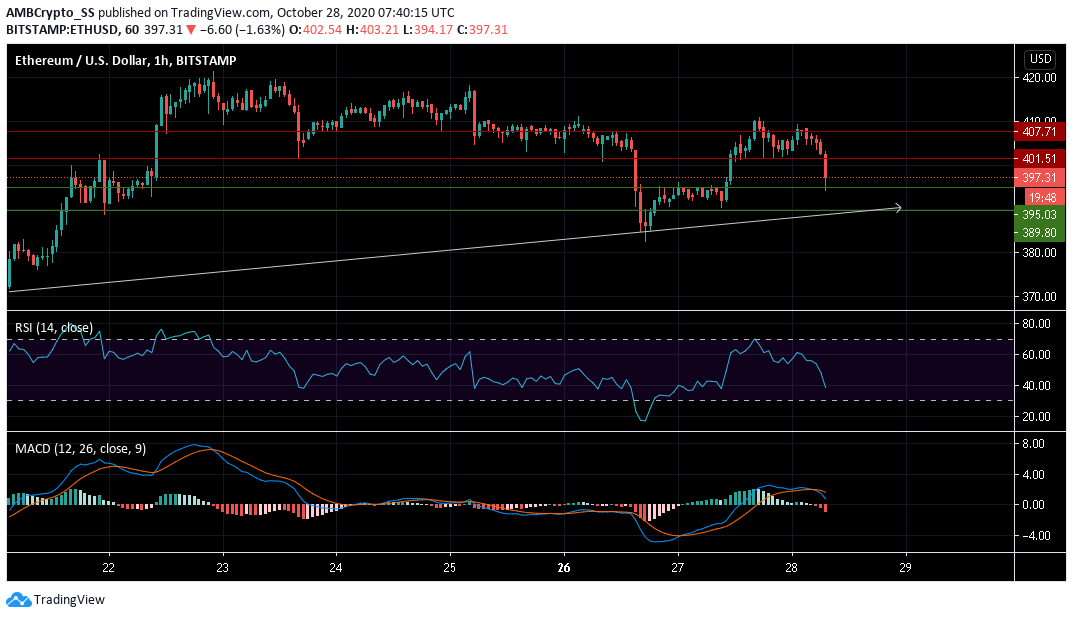
Ethereum continued to trend bearish as it broke out below its $407.71 resistance level, yesterday. The digital asset at the time of writing was trading at $397 below its previous day’s closing price.
In fact, this further corresponded with a rise in selling pressure due to the dive below the 40 level, witnessed in the Relative Strength Index (RSI). The MACD, also, gave a sell signal, with bearish momentum visible in the short term.
With both the RSI and MACD hinted towards selling pressure, Ethereum could be seen retesting the $389.80 support level, before witnessing any pullback in prices.
Monero [XMR]

Source: XMR/USD on TrdingView
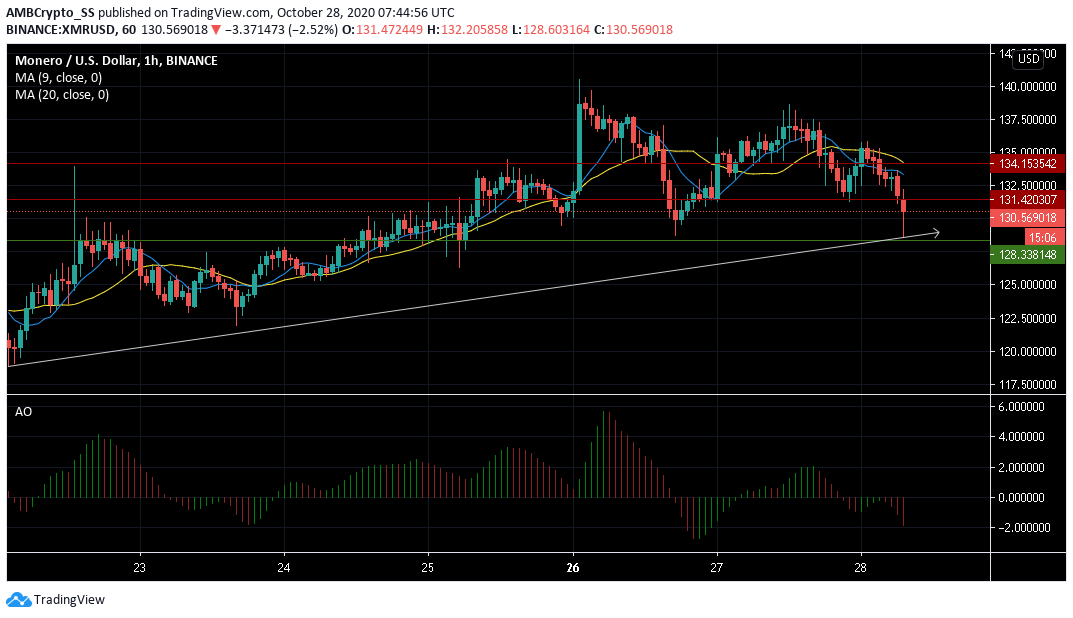
At the time of writing, Monero was trading just above its trendline around the $130.56 level. The Awesome oscillator noted bearish market momentum, with the histogram’s red bars crossing below the zero line.
The price was also re-testing the support at $128.388 as sellers tried to regain their strength around that level. Furthermore, the selling sentiment continued as the 9-day Simple Moving Average (cyan) dived below the 20 SMA (yellow) and pointed to a bearish crossover over the day.
Algorand [ALGO]

Source: ALGO/USD on TradingView
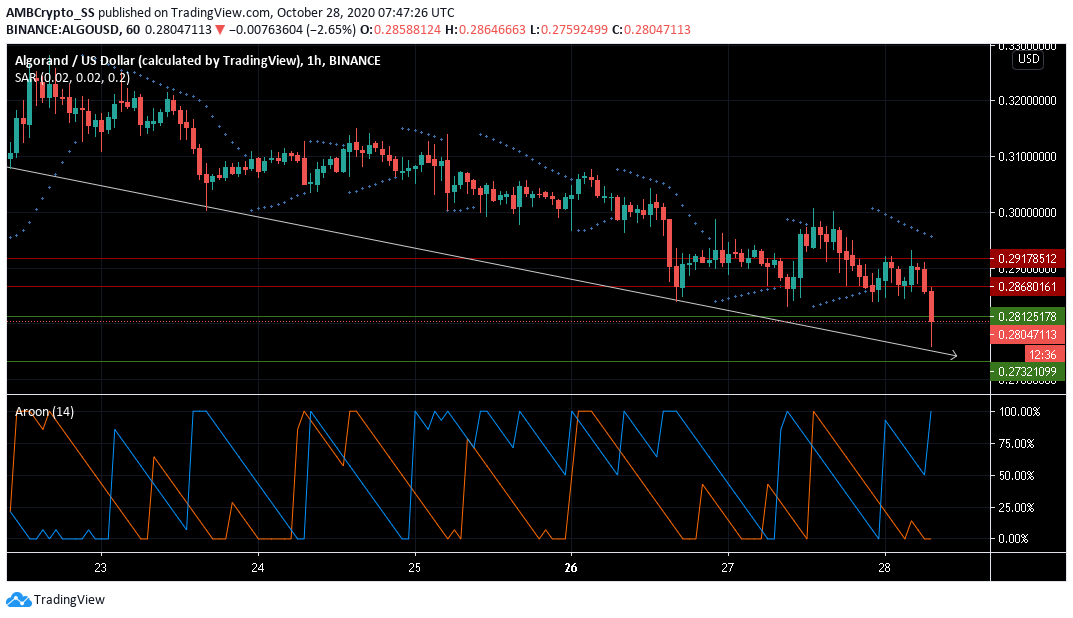
Maintaining an overall downtrend amid high selling pressure, Algorand witnessed a further dip in its price in the last 24-hours. In fact, the digital asset dived towards its support turned resistance level at $0.273
At press time, Algorand was trading at $0.280, just below the recently breached support turned resistance level. The bearishness in the digital asset was also evident from the Aroon Indicator.
In a bearish crossover, the Aroon down (Blue) moved above the Aroon up (orange). The placement of the dotted lines of the Parabolic SAR above the candles suggested a downtrend.
Therefore, a dip below the trendline could be an indication of rising selling pressure and the price going down further in the next few days.


