Analysis
Ethereum might record 23% rise after brief downward correction

Ethereum has been performing exceptionally lately, recording over 70% gains since the start of the year. After a brief visit to the $230 level, however, ETH has fallen to $219, where it currently stands at the time of writing. With a market capitalization of nearly $24.3 billion, nearly $14.6 billion worth of ETH was traded over the last 24 hours, according to CoinMarketCap.
Ethereum 1-day chart

Source: ETH/USD on TradingView
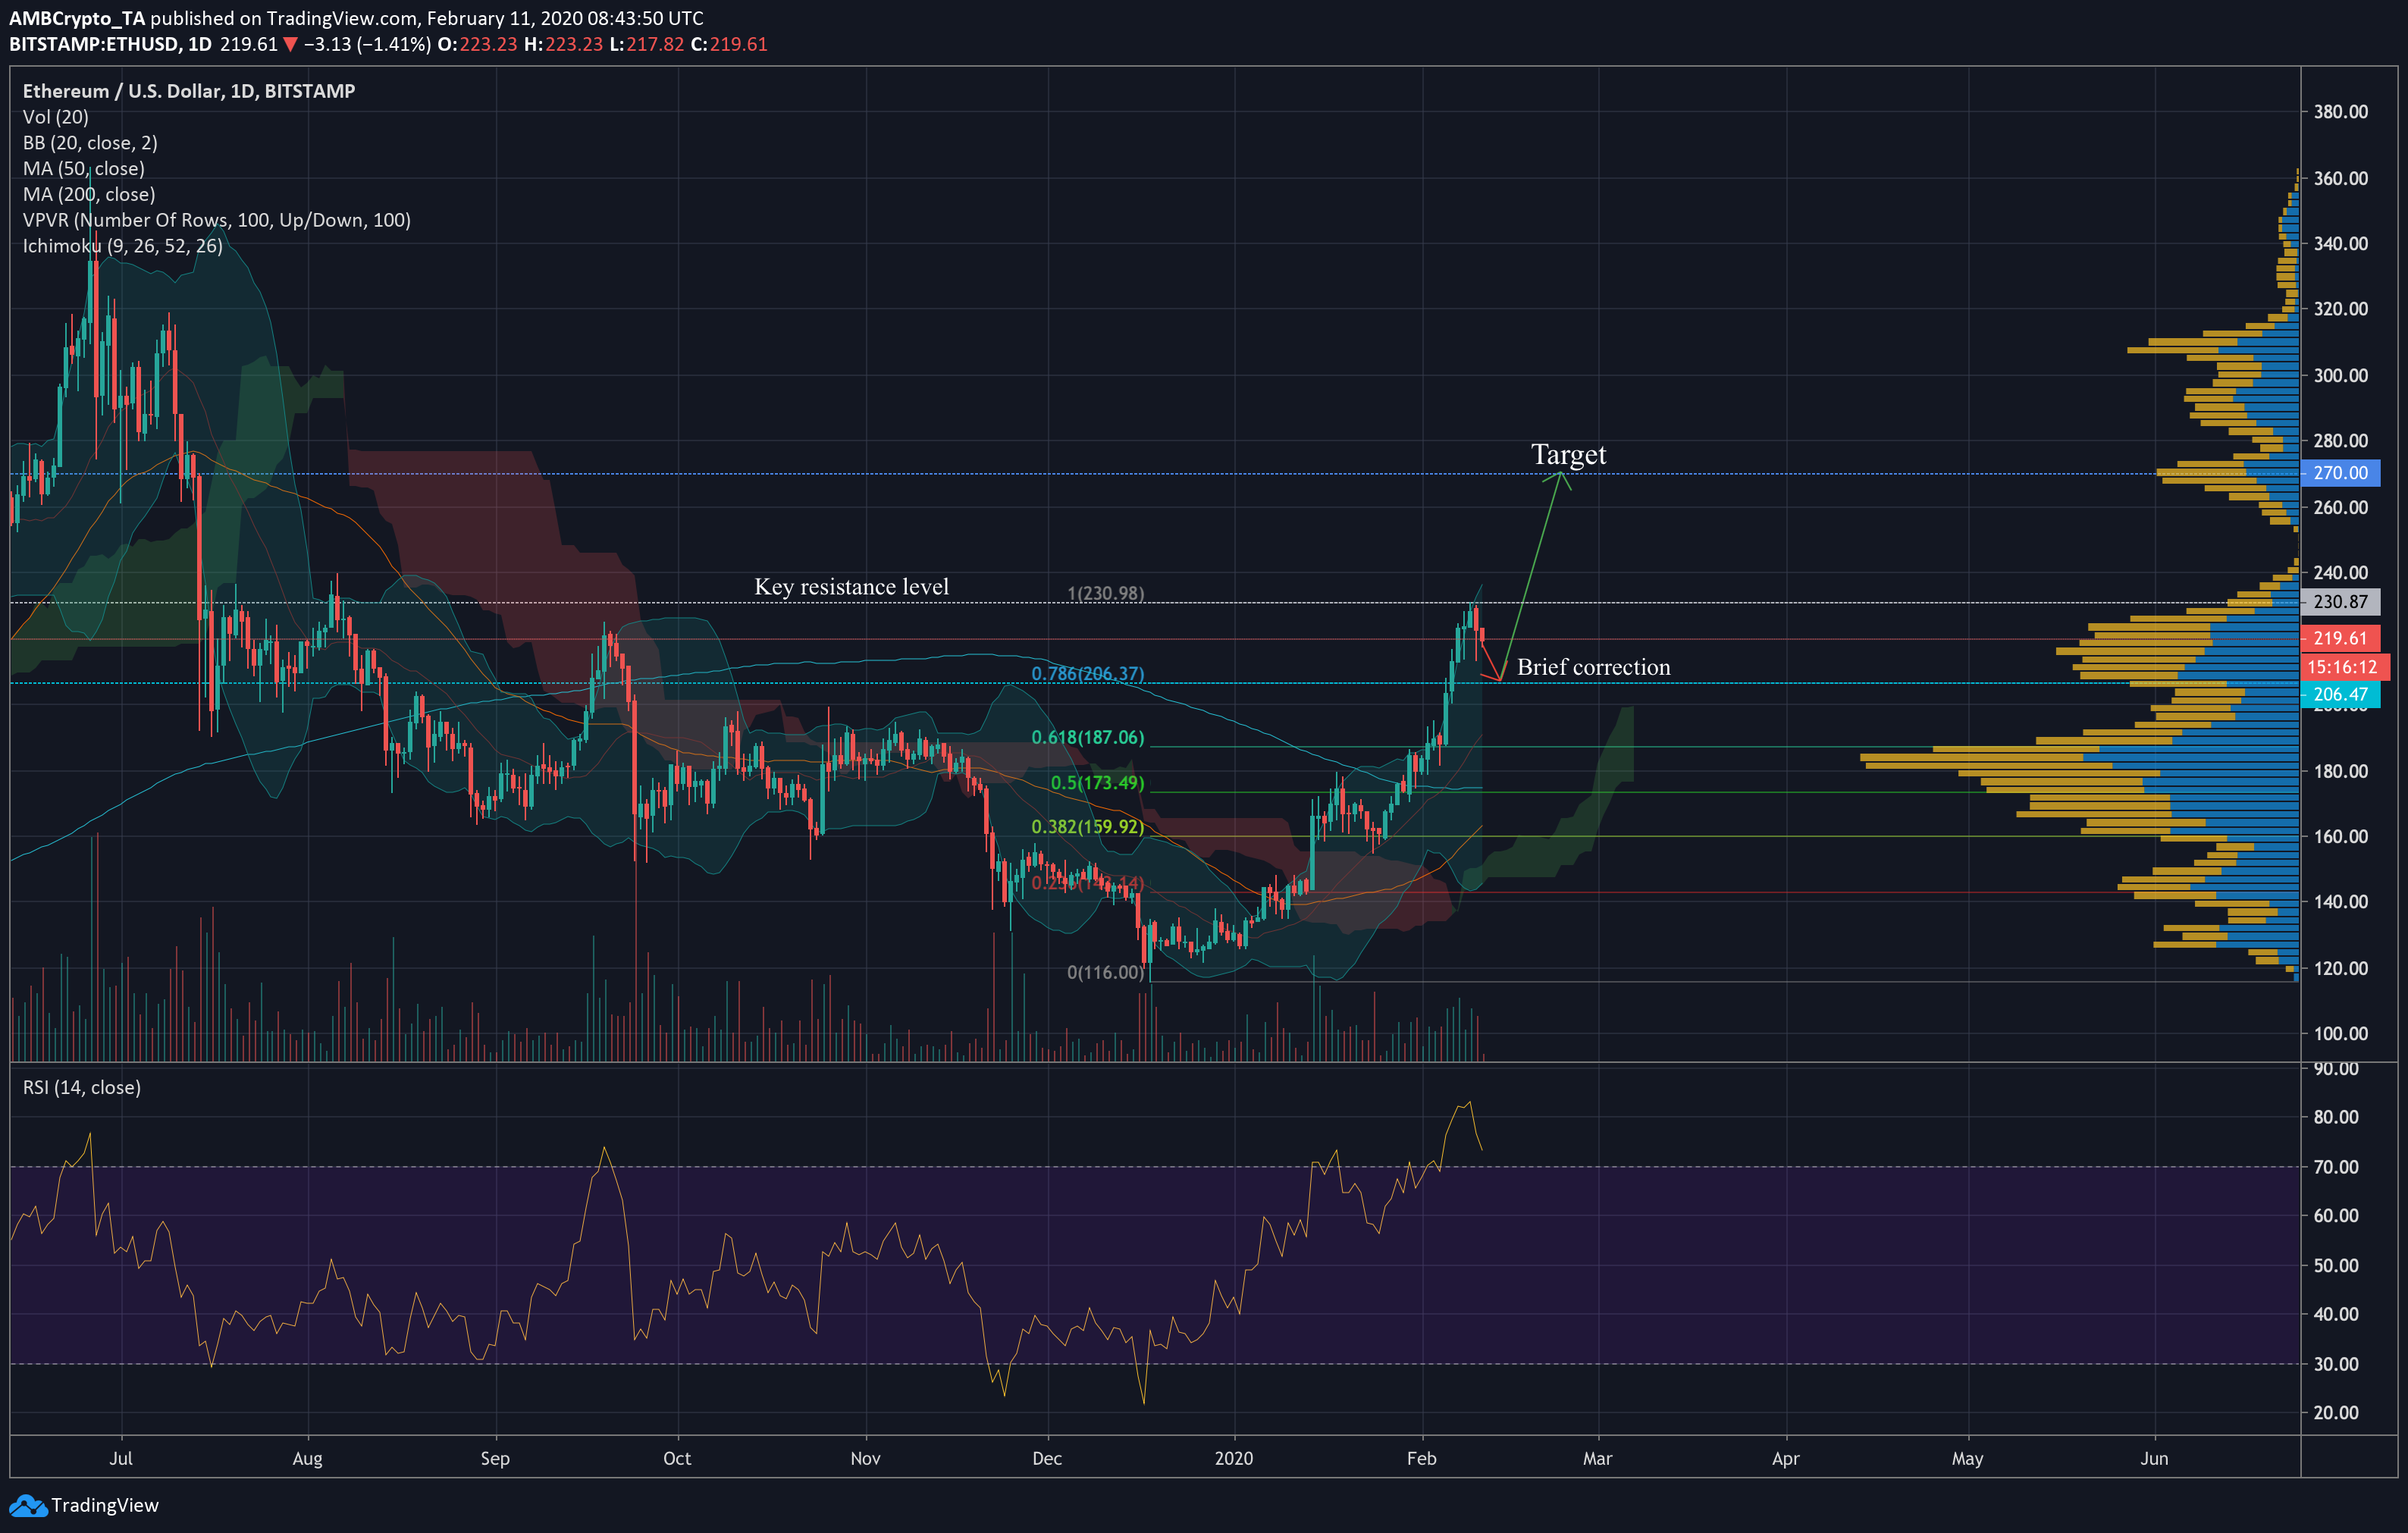
Since ETH touched the $230 level two days ago, the cryptocurrency has seen a slight dip down in value, a movement that seems to be a correction, given the overall bullish scenario. This is similar to what happened in mid-January when a ~13% downward correction followed ETH’s 42% rise from the start of the year.
The $230 level has historically been a strong support/resistance level and ETH’s move above it could have significance beyond its immediate gains. Both the 50 and 200-day moving averages were seen moving under the price candles; however, they still maintained their death-cross formations since September last year.
Considering how markets tend to correct after huge upward spikes, it seems quite likely that Ethereum will see downward movement in the next few days. However, strong support at the 78.6% Fibonacci retracement line suggests that a bounce-back could follow.
Bollinger bands indicated a highly volatile environment for the flagship Ethereum cryptocurrency and while this might be cause for alarm in the short-term, both the lower and upper bounds seemed to be curving upward. Additionally, this could imply stronger corrective action, especially considering recent higher volumes and the existence of a high volume node at the 61.8% Fibonacci retracement line.
However, the Ichimoku Clouds predicted an overall bullish movement, presenting a green cloud under the price line. This means that even if the price falls below the $206 level, it is likely that ETH will push back above soon after. Further, the Relative Strength Index (RSI) reported an overbought market that seemed to be correcting back into the stable region. This might imply an incoming upward movement after the RSI moves back under the 70.0 mark.
Such a move would likely push ETH up to the $270 mark over the next two weeks, especially considering how volatile the asset is at the time of writing.
Active Addresses
Source: Glassnode
Though an increase in the number of active addresses on the Ethereum network isn’t necessarily a direct representation of greater adoption, it does suggest that the network is being used more. After seeing a steady decline in active addresses since November 2019, data from Glassnode showed that more users might begin actively using the network this year.
With trade volumes being supported by a larger number of addresses, Ethereum could be in for a more robust and bullish market in the future.
Conclusion
Though the moving averages and Ichimoku Clouds predict bullish movements, a brief correction to $206 seems likely given how ETH has been moving in recent times. With the possibility of a golden cross in sight for the MAs and the RSI appearing to be diving back under the 70.0 mark in the face of increased volatility, this correction could be followed by a pump to $270 in the next two weeks.
While such a move will likely be followed by a corrective dip, the rising number of active addresses on the Ethereum network could also facilitate more bullish movements in the long-term.

