
Disclaimer: The conclusions of the following article attempt to foresee Ethereum’s price movement, leading up to a potential breakout in the first week of July.
Ethereum noted a sharp decline in value over the past week, a decline that followed a brief upswing that saw the token going close to $250. The latest pullback in the cryptocurrency’s price pulled down the crypto’s price to $224.09, at the time of writing.
Interestingly, despite brief bullish momentum in the market and the optimism around the upcoming launch of Ethereum 2.0, the world’s second-largest cryptocurrency has been flashing subtle signs of long-term weakness on the charts.
Ethereum [ETH] Hourly Chart
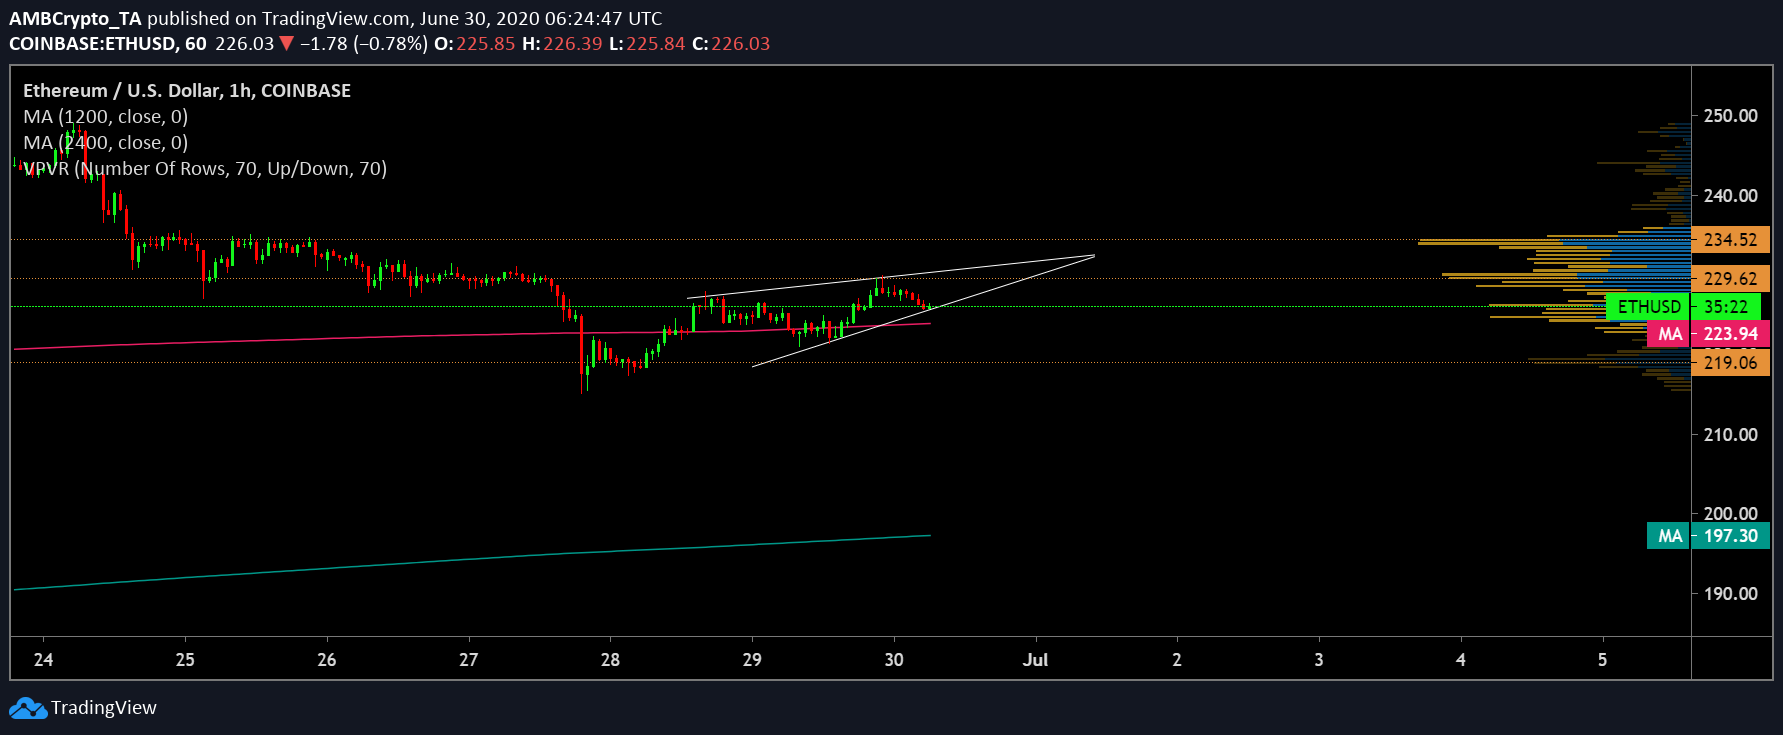
Source: ETH/USD on TrdaingView
At the time of writing, Ethereum’s price candles appeared to be oscillating between the trendlines of a rising wedge, the completion of which is expected to happen sometime in the first week of July. A potential downside break could follow after the completion of the pattern.
The daily moving averages, however, told a very different story. The 50 DMA [Pink] continued to hover over the 100 DMA [Blue] on the charts after a bullish crossover. Additionally, both the DMAs were observed to be resting well below ETH’s price candles on the charts, forming critical support levels for the cryptocurrency, while acting as roadblocks against a steeper decline in price.
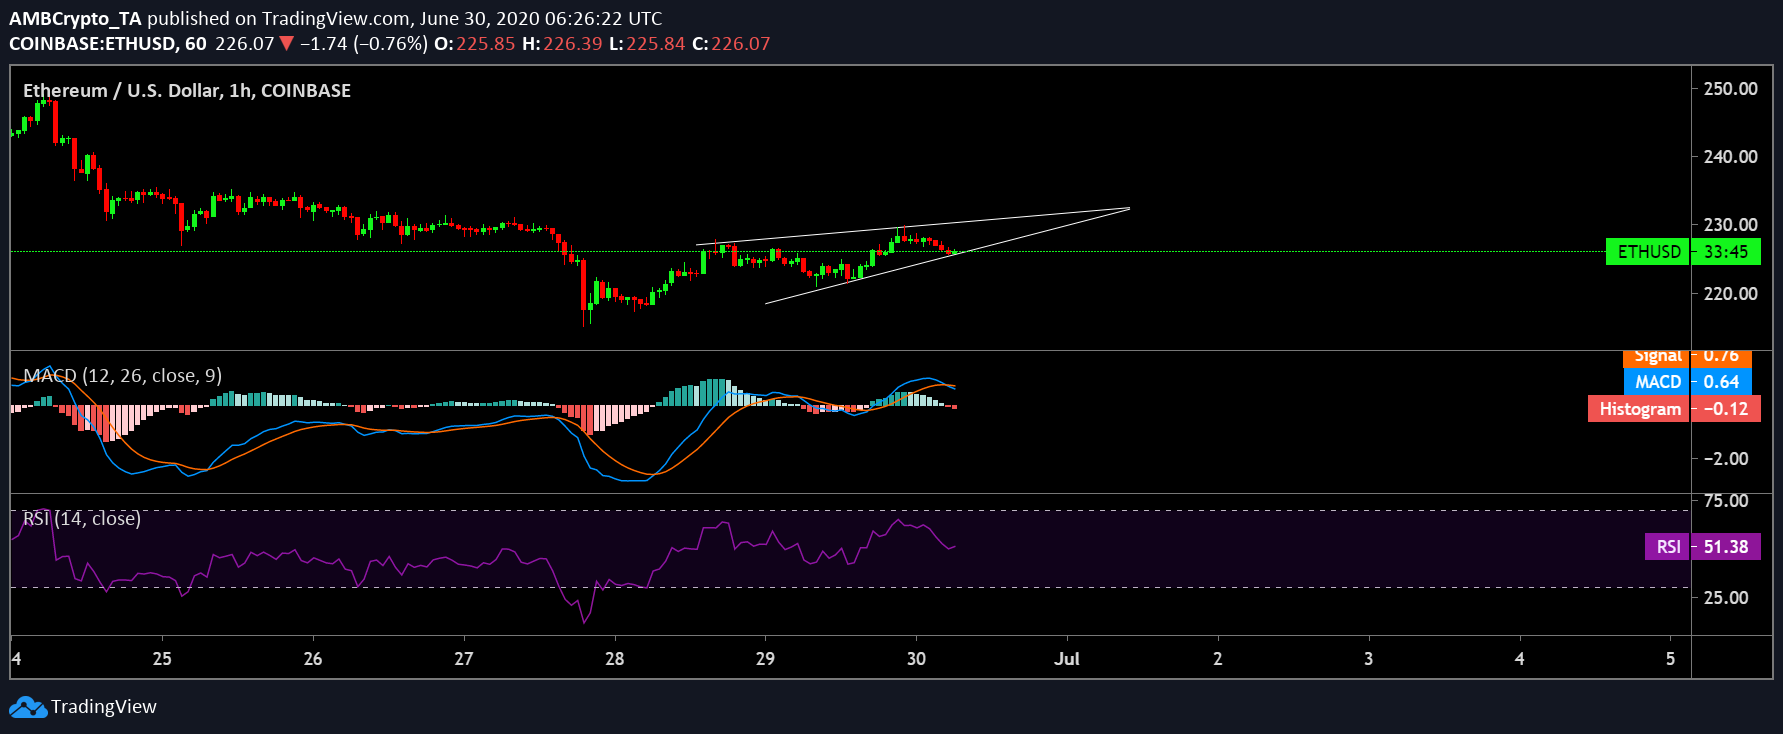
Source: ETH/USD on TradingView
As for ETH’s market indicators, they were pictured to be aligning with the bears. While the MACD line underwent a bearish crossover as it slid below the signal line, at the time of writing, the Relative Strength Index, while closely imitating ETH’s price action, also fell close to the 50-median line. This was a sign of sentiment around declining buy pressure gathering steam among investors in the ETH market.
As can be established by the attached long-term charts, the prospect of a bullish reversal looked bleak, at the time of writing, as the coin had previously been rejected at $229.6 and $234.5, respectively. Instead, ETH’s charts predicted a bearish breakout in the first week of July.
If this comes to pass, the cryptocurrency could find itself close to breaching its 50 DMA at $223. Further, if the bears do indeed breach this level, ETH’s price could drop all the way to $219.06 on the charts.