
Disclaimer: The following price prediction does not foresee a clear price position as of now due to the lack of a price pattern.
Ethereum’s price movement over the past week has been astonishing. Witnessing a massive 40 percent hike since the 26th of July, the largest altcoin has brushed past key resistance, while registering a new all-time high for the year. At the moment, the price movement over the next few days is difficult to estimate since the breakout is still taking place.
At the time of writing, Ethereum had a market cap of $35 billion with the asset being valued at $316.
1-day chart
Source: ETH/USD on Trading View
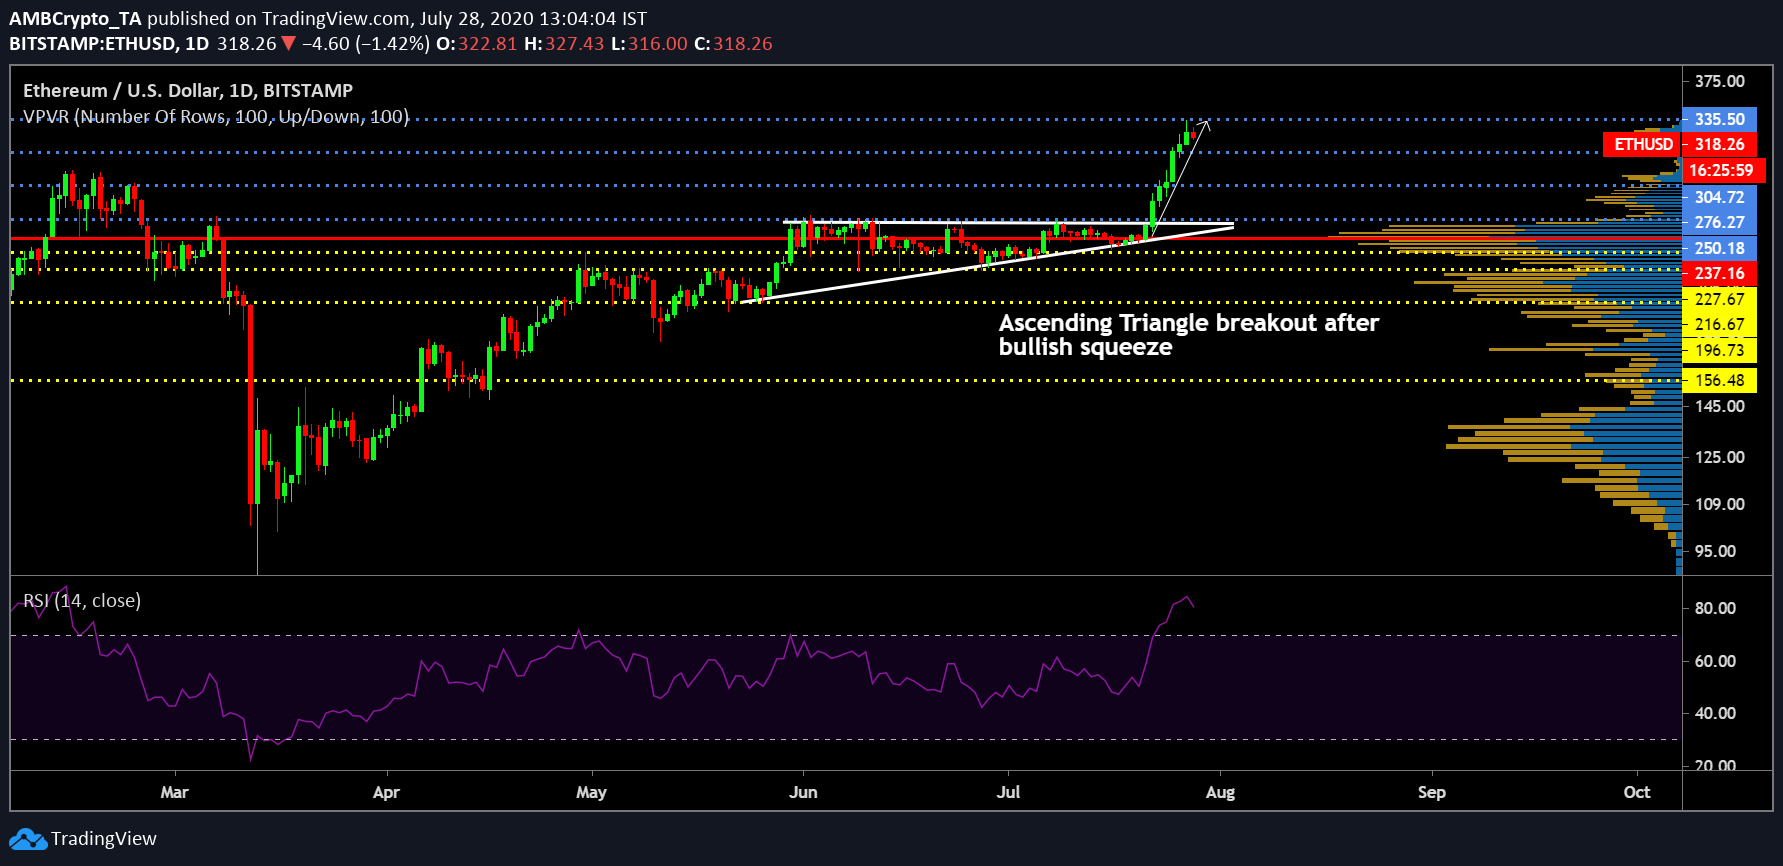
On the 1-day chart, the trend leading up to the bullish breakout on 26th July looks fairly straightforward. An ascending triangle started forming towards the end of May. An upper trend line was fixed at resistance $250, and after three back-to-back touches, the valuation broke out of a bullish squeeze.
The rally over the past week has surmounted multiple resistance at $250, $276 and $304. After crossing $289, Ethereum marks its new-all yearly high moving away from its price point registered during February 2020.
However, the asset didn’t really test the resistance at $335, which was the yearly high of 2019. At the moment, a red candle has appeared after 7-day consecutive green candles. After reaching an over-bought section, while the Relative Strength Index is starting to decline as well.
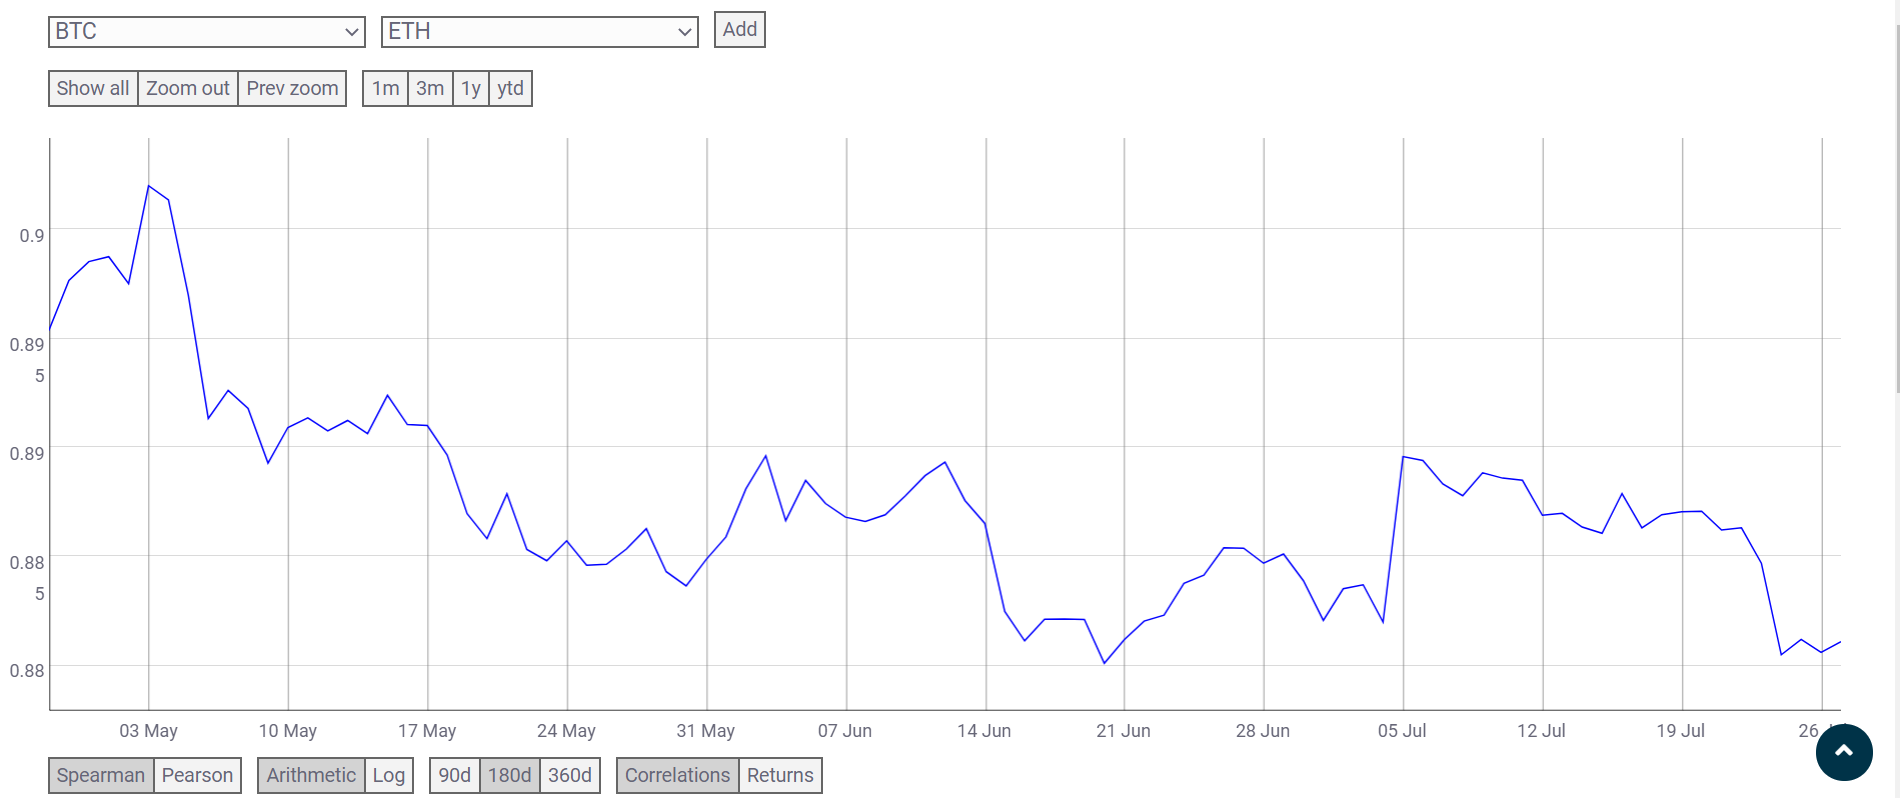
Source: CoinmetricsNow, if many expected that current rally to rely on Bitcoin, the above correlation chart cites the fact that ETH-BTC has seen a dip in correlation over the past couple of months. It was noticed in the current rally as well, with Ethereum rallying 24-hours before Bitcoin. Furthermore, during Bitcoin’s rally above $11,000 over the past day, Ethereum failed to register any surge of its own.
But Ethereum looks bullish in the long term
Source: ETH/USD on Trading View
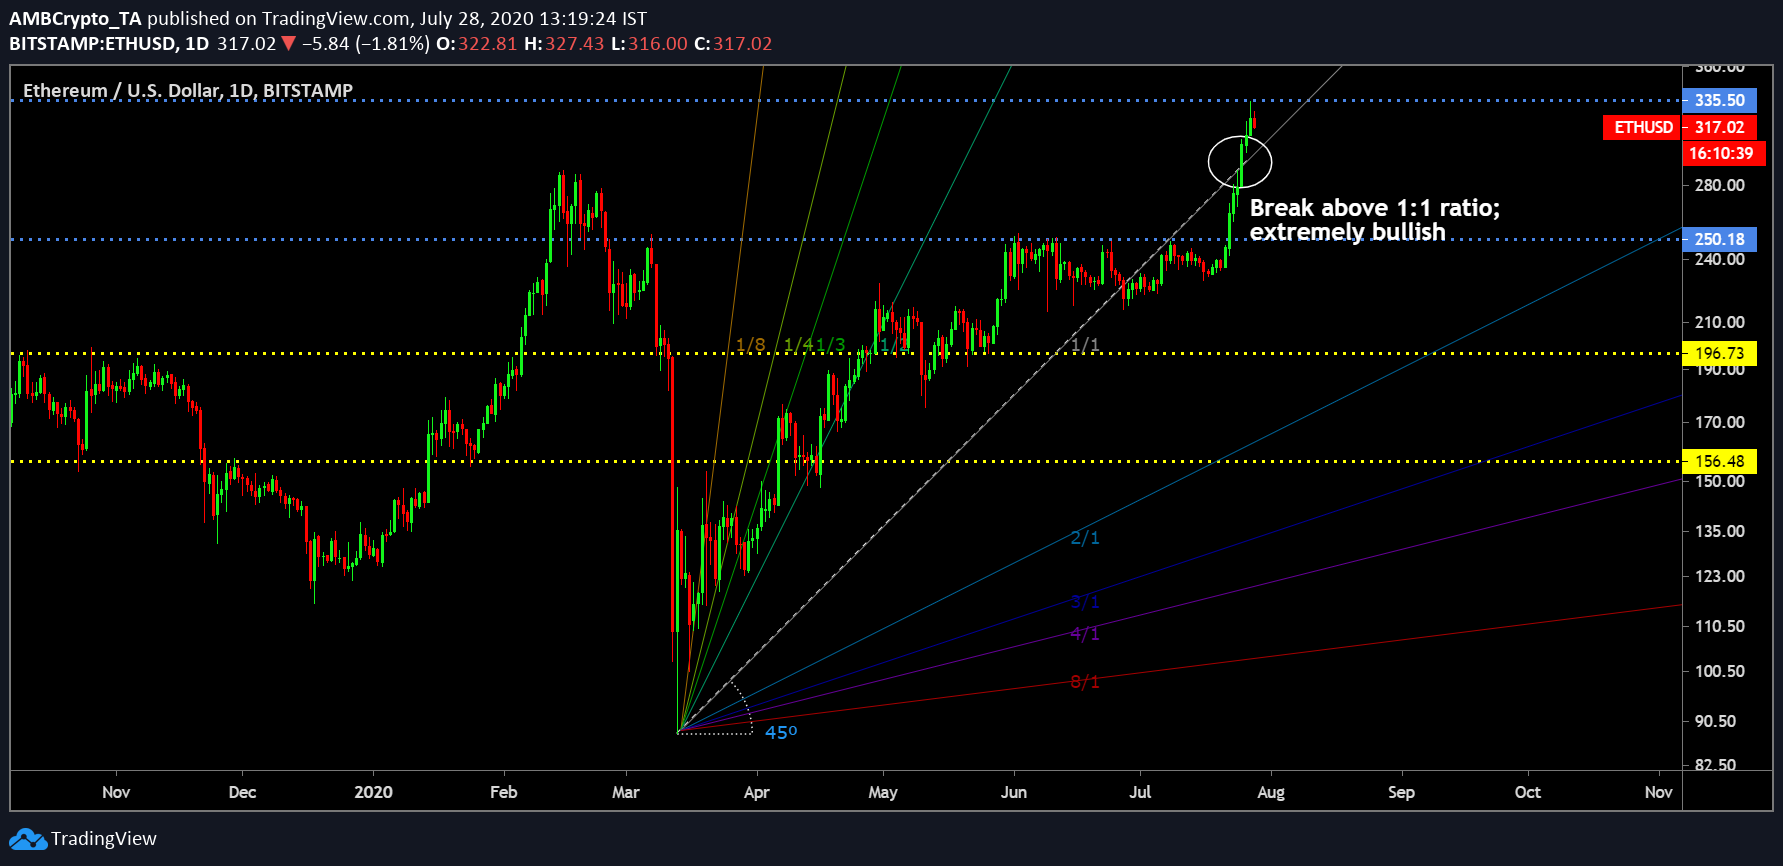
Now a key change in the scenario can be observed from the Gan Fann indicator. According to the above chart, after oscillating under the 1:1 ratio line for 5 weeks, Ethereum regained position above the 1:1 ratio, which is indicative of a strong bullish trend. The chances will be high for Ethereum now to sustain a position above $300, before embarking on another strong price spike.
Conclusion
Ethereum’s price is likely to decline over the next few days after that the asset should consolidate above the $300 mark.