
Disclaimer: The findings of the following article are the sole opinion of the writer and should not be taken as investment advice
Ethereum has been the most-relied upon smart contracts platform since ‘smart contracts’ became a thing. Despite ICOs raising billions and many projects promising the world, none of them have come close to competing with it.
Recently, however, the current platform, notwithstanding its popularity, has been facing issues due to its success. The platform will not be able to handle loads without higher fees, and hence, this would prevent retail from accessing it. The shift to ETH 2.0 has been promised for a while now, but it hasn’t arrived yet.
Perhaps, by the next bull run, if ETH 2.0 is up and running, Ethereum’s prospects might be given a boost of an extraordinary degree. However, at the time of writing, Ethereum exhibited weakness in its price. The following article will outline the said weakness and ETH’s potential targets.
Ethereum 1-day chart
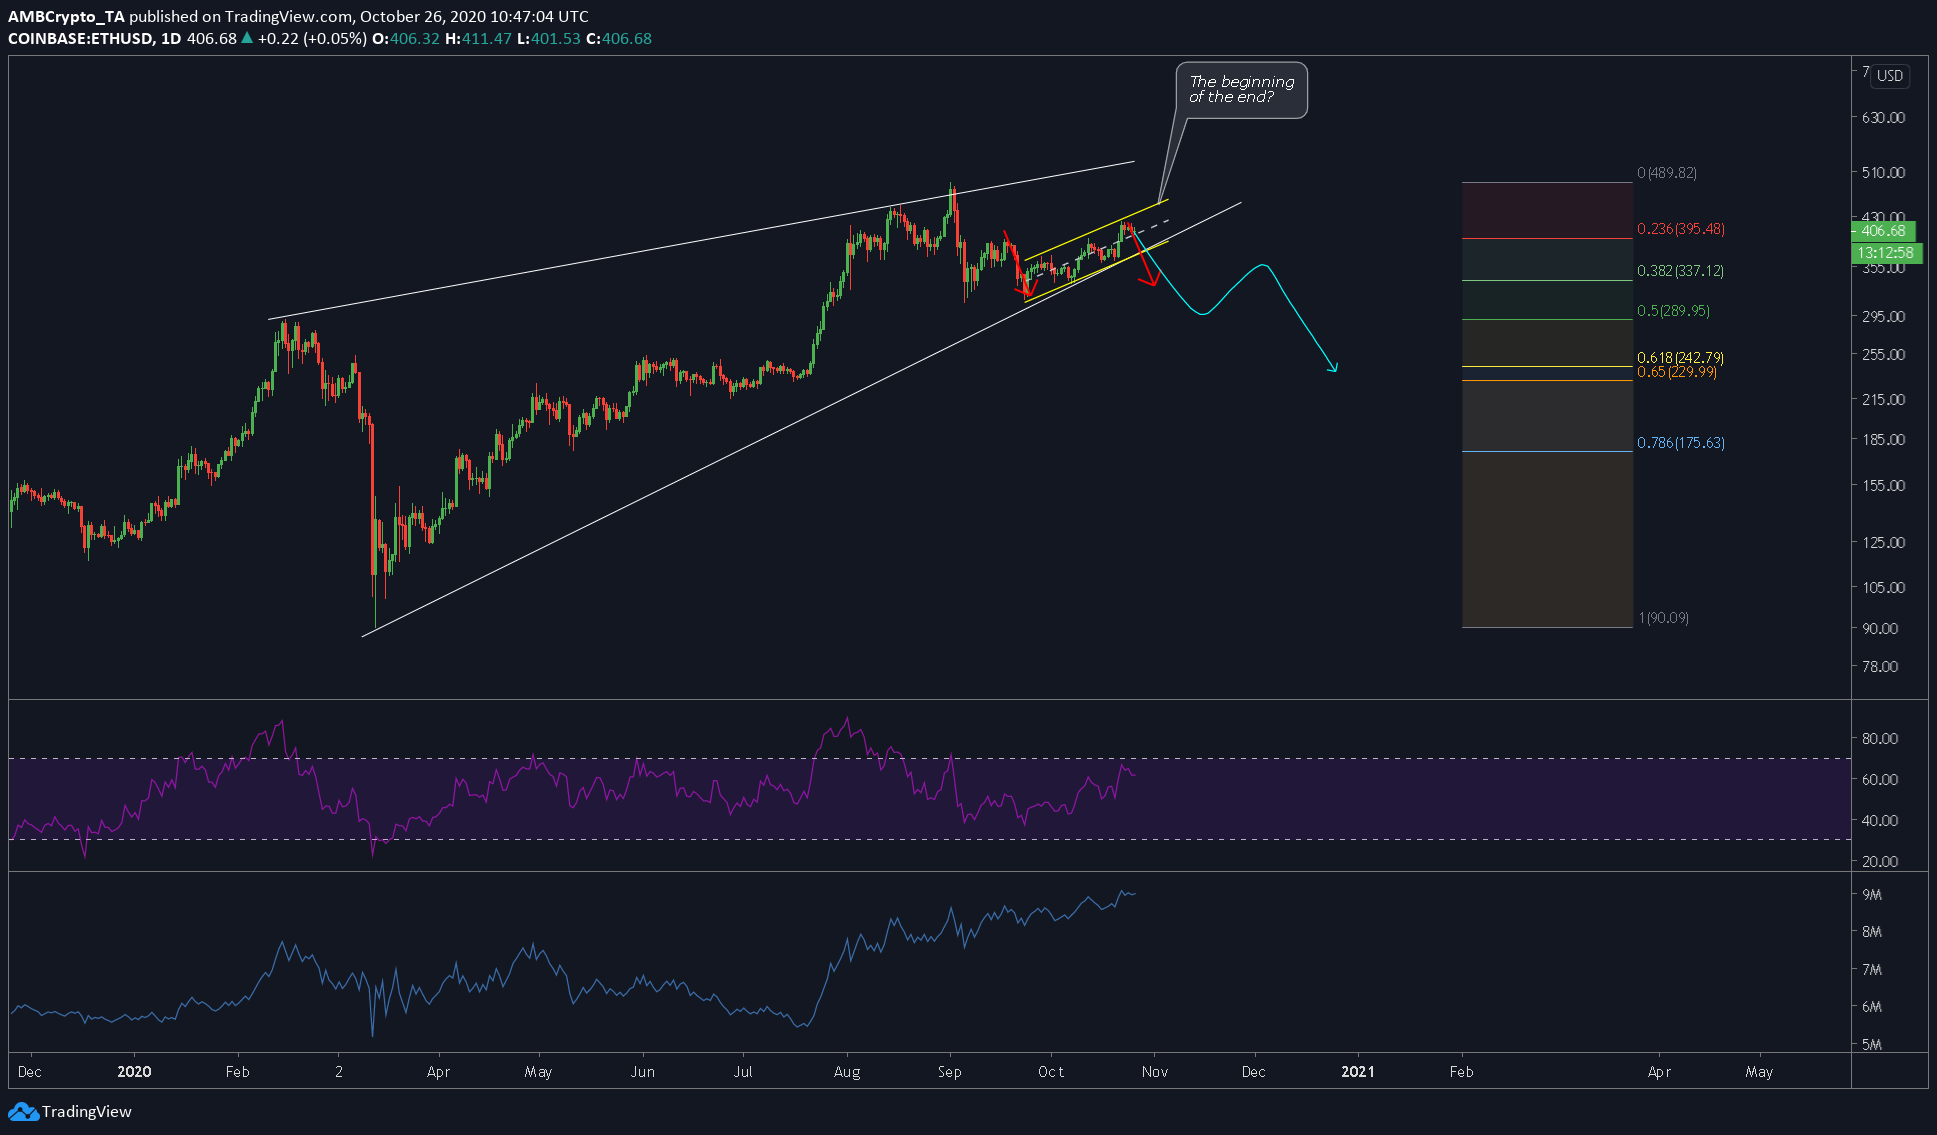
Source: ETHUSD on TradingView
The attached chart has three parts to it – The patterns, the fib levels, and the indicators. The patterns include a large rising wedge [bearish] and a much smaller ascending channel [bearish].
While the price was almost at the end of its span, at the time of writing, a breakout was anticipated. And, at the said point, an ascending channel was forming, a formation that might trigger the bigger breakout. The ascending channel is more of a continuation pattern aka the bear flag. This showed that the initial target of the breakout will push ETH down to $330 [red arrow], and the target for subsequent breakouts will need Fibonacci levels.
The Fibonacci tool showed that 0.382 [$337], 0.5 [$289] and the golden pocket ranging from $242 to $229 were potential targets.
Rationale
This section addresses mainly the indicators. At the time of writing, the RSI was retracing from the overbought zone, highlighting the exhaustion of the market’s buyers. Further, the OBV indicator was heading higher, with the price and the OBV forming a bearish divergence. Hence, the rationale for this technical analysis is that the price will head lower.
Conclusion
One caveat here is that the price of ETH will not head down if the rest of the market [or BTC] decides to rise higher [with strong volumes]. Since BTC and ETH correlation has been constantly high, we can expect this bearish scenario explained above to go void if the markets surge. Moreover, BTC hasn’t filled the gap down at $9.600, hence, if BTC initiates a drop, then this bearish scenario will play out.
Please note that this is on a higher time frame of days/weeks, and hence, it will take time to evolve.