
Ethereum 2.0 is still in the works after many delays. And yet, it is still receiving a lot of praise from the likes of CFTC Chairman Heath Tarbert. While the ETH community is stoked about this, others have critiqued ETH’s timeline to deliver ETH 2.0.
At press time, there were many ETH competitors, but none at a level that could threaten ETH. In fact, while most of the DeFi and smart contract landscape falls under ETH’s purview and new competitors like DOT or BNB etc. have emerged, none are near competing with ETH.
ETH is still the 2nd-largest cryptocurrency in the world, with the altcoin trading at $375 per token, at press time. The long-term scenario for ETH, like BTC, was bearish due to various reasons.
Ethereum 1-day chart
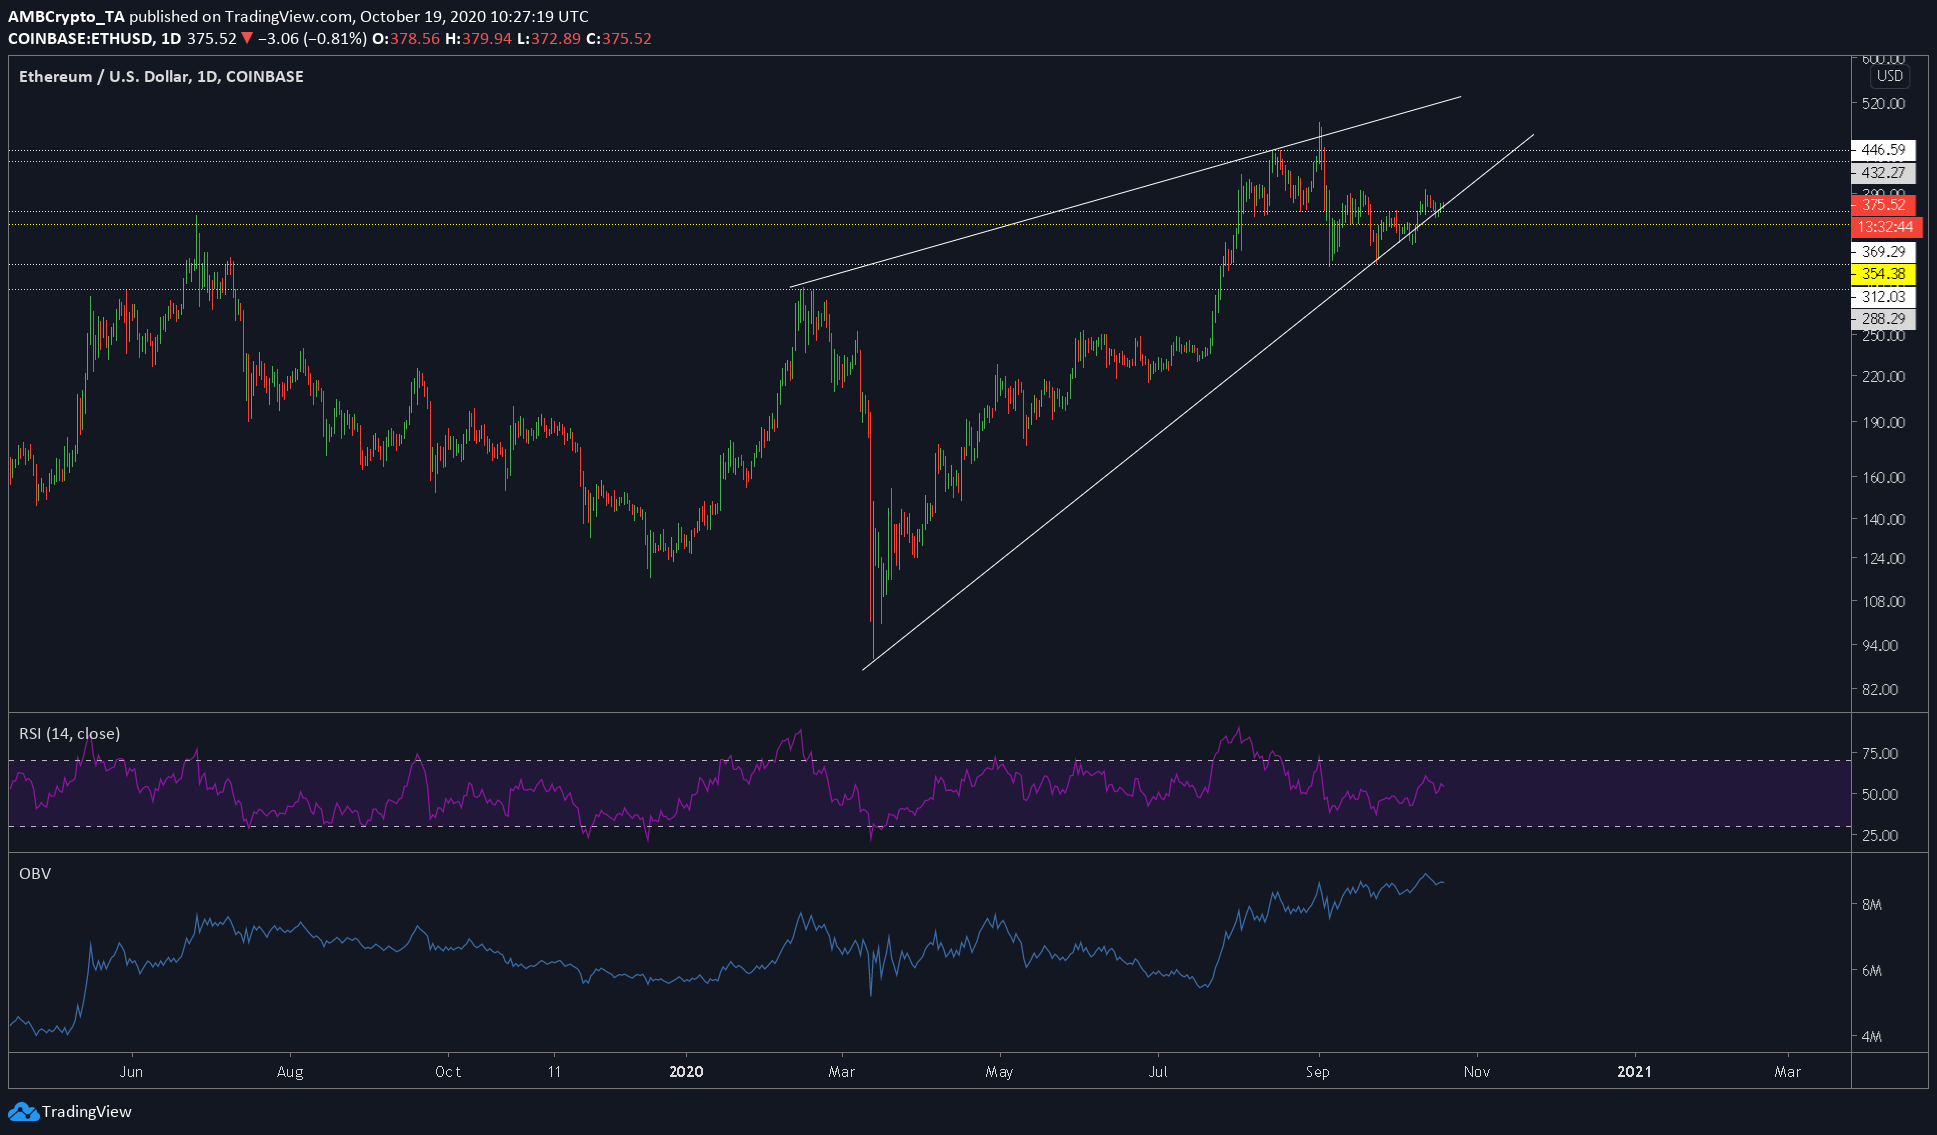
Source: ETHUSD on TradingView
The one-day chart for ETH showed why ETH is mainly bearish in the long-term. It is due to the formation of a rising wedge, one that extends all the way back to Black Thursday [7 months].
Breaking out of this pattern would suggest a drop of at least 15-20% [on the bright side]. However, if the drop starts cascading, then we can expect the price to drop 40+% and hit $210.
The RSI indicator, like the price, was consolidating, and a breakout might help with the aforementioned drop. The OBV indicator showed that the latest price action was backed by strong volume. The extent of the same can only be determined when the price actually drops and when the market reacts to it.
For now, we can take a closer look at the chart to see what might happen in the mid-to-long term scenario.
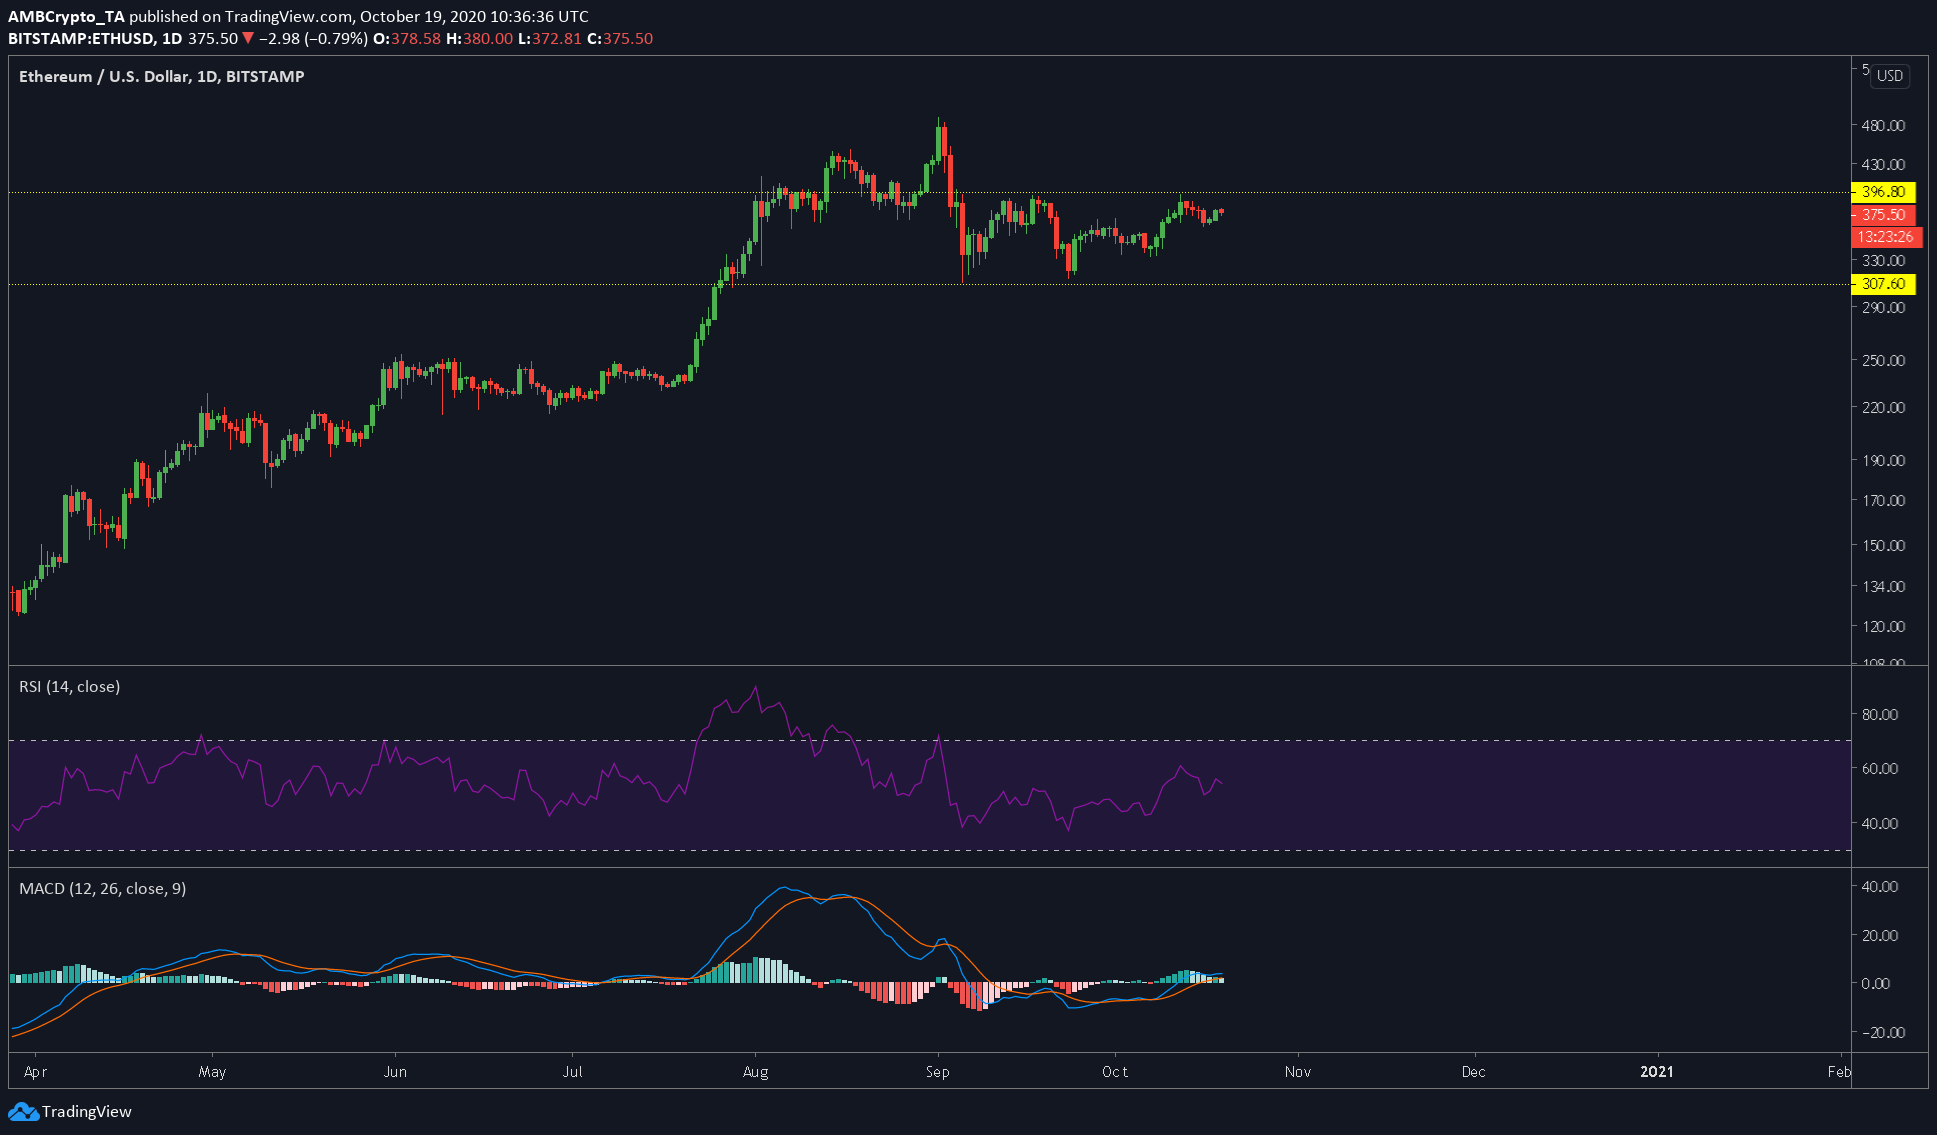
Source: ETHUSD on TradingView
According to the attached chart, ETH was range-bound between $396 and $307, and at press time, the RSI indicator was slightly above the neutral zone. However, the MACD indicator showed that the bullish crossover that took place in early October might be losing momentum.
So, if there’s one thing to conclude from this chart, it is that ETH is not breaking this range and it will head to the lower range soon.