
Disclaimer: The following price prediction should materialize over the next two weeks.
On May 28th, when Ethereum surged by 8.75 percent, the 2nd largest digital asset breached above the resistance of $226. Now over the past five weeks, the asset has been able to maintain consolidation between $227 and $250 albeit a minor decline on 24th June, when the asset dropped below the aforementioned range for 5 days. However, things might be taking a drastic turn in the markets as a long-term pattern seems likely to complete formation in the near future.
12-hour chart
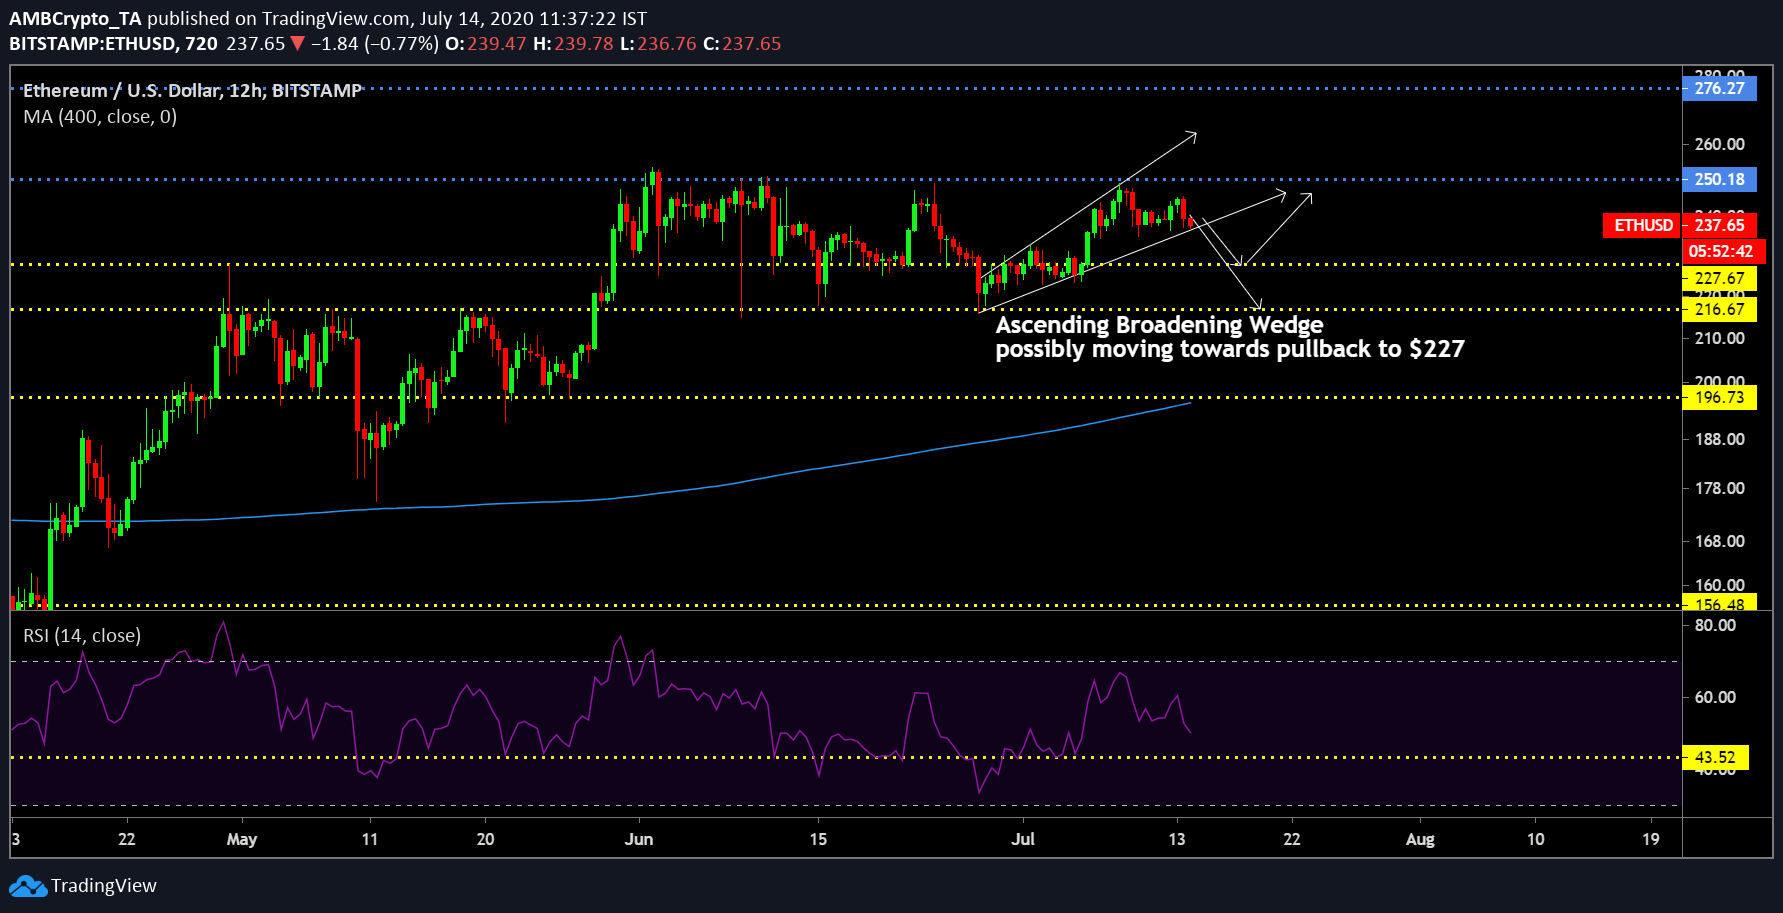
ETH/USD on Trading View
According to the analysis above, Ethereum’s valuation has been oscillating within the trend lines of an ascending broadening wedge since 28th June. Prominent higher highs were observed on $232 and $247, where higher lows were seen at $216, $224 and $236. With the price hovering near the lower trendline of the pattern after a partial rise on 13th July, the possibility of a pullback looms large in the charts.
Hence, a re-test at $226 might be evident over the next week or two. A higher bearish momentum may take the valuation all the way down to $216. Relative Strength Index or RSI remains on a decline which indicated that selling pressure is taking charge. However, the long-term pattern which may dictate the price direction over the next month is pictured below.
1-day chart
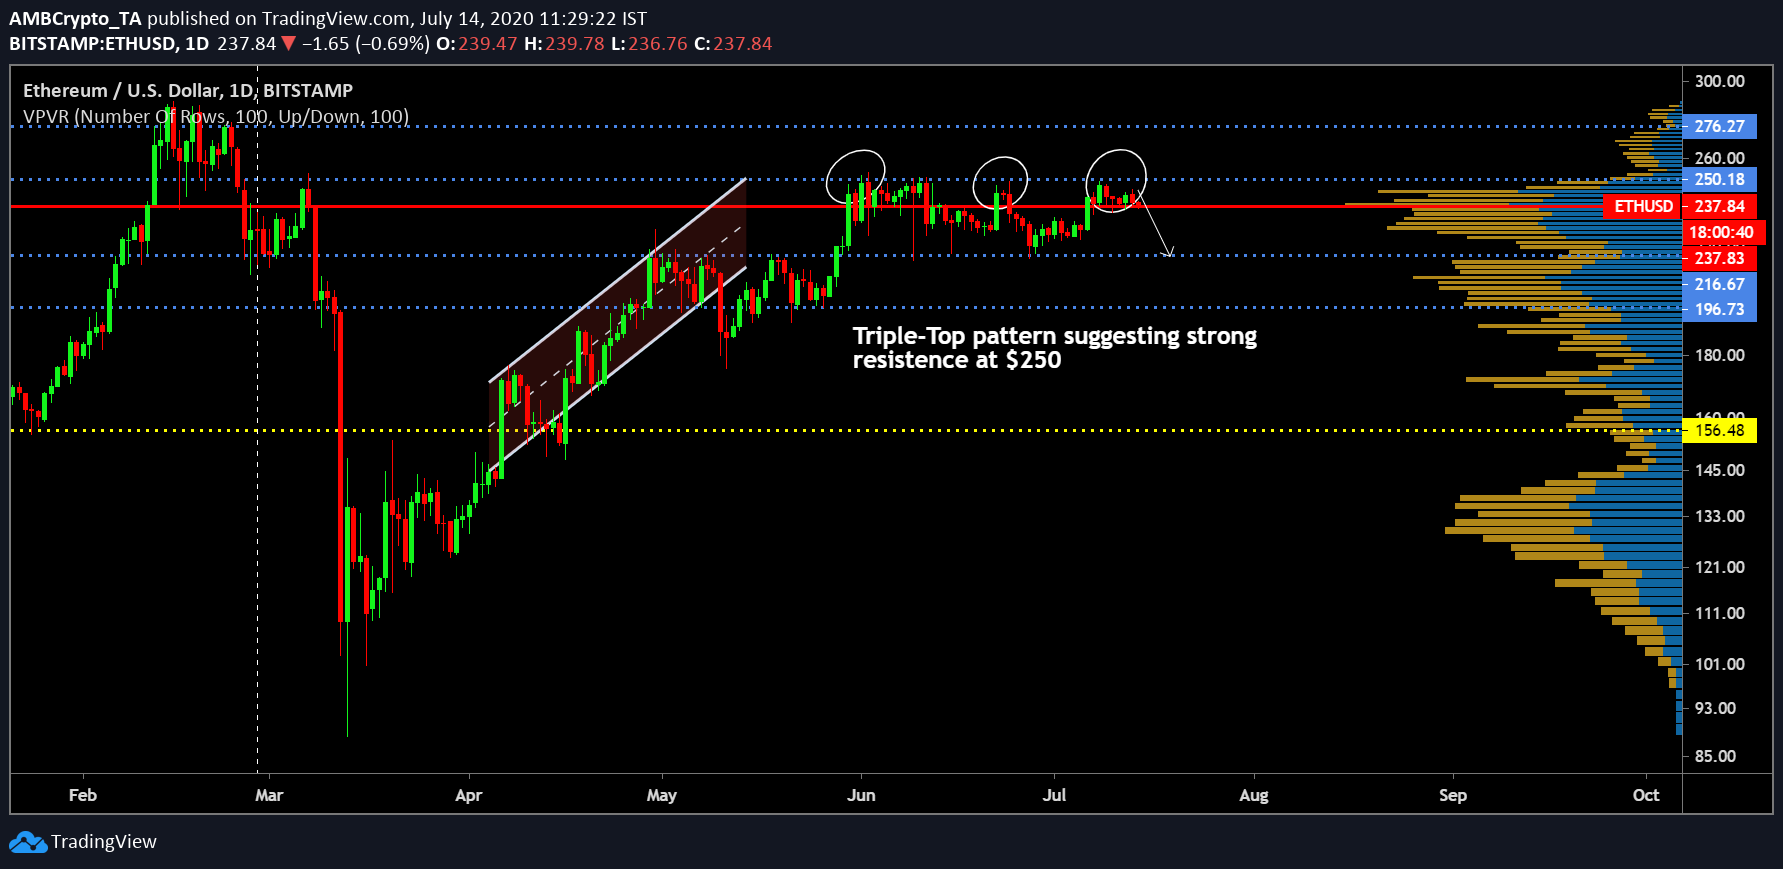
ETH/USD on Trading View
Since the end of June, Ethereum’s valuation can be seen testing the resistance at $250 for a total of three times. Considering the asset declines down to $216 support, a triple-top pattern will be confirmed which may have major bearish implications. The inability to breach resistance at $250 would discourage buying pressure if the valuation drops down to $216. With higher trading volume evident in the current range, the likelihood of a confirmed triple-top is yet to be concrete but the possibility remains.
However, the fact the 200-moving average continues to act as strong support should keep the assets hope alive to undergo a rally after its current correction period is over but still, a strong pullback is not out of the picture just yet.
Conclusion
Ethereum will possibly re-test $226 by the end of July or by the third week of the month.