Analysis
Ethereum, Litecoin, XRP, Tron, Monero; Price Analysis 10/09

When we talk about altcoins in the cryptocurrency market, we usually talk about all coins apart from Bitcoin [BTC]. The majority of alts have been depreciating since the collective bullish phase concluded in the 2nd quarter of 2019, but the second wind of bullish surge was apparent for a few of them. At press time, Bitcoin [BTC] dominated the cryptocurrency market with a dominance index of 69.7 percent.
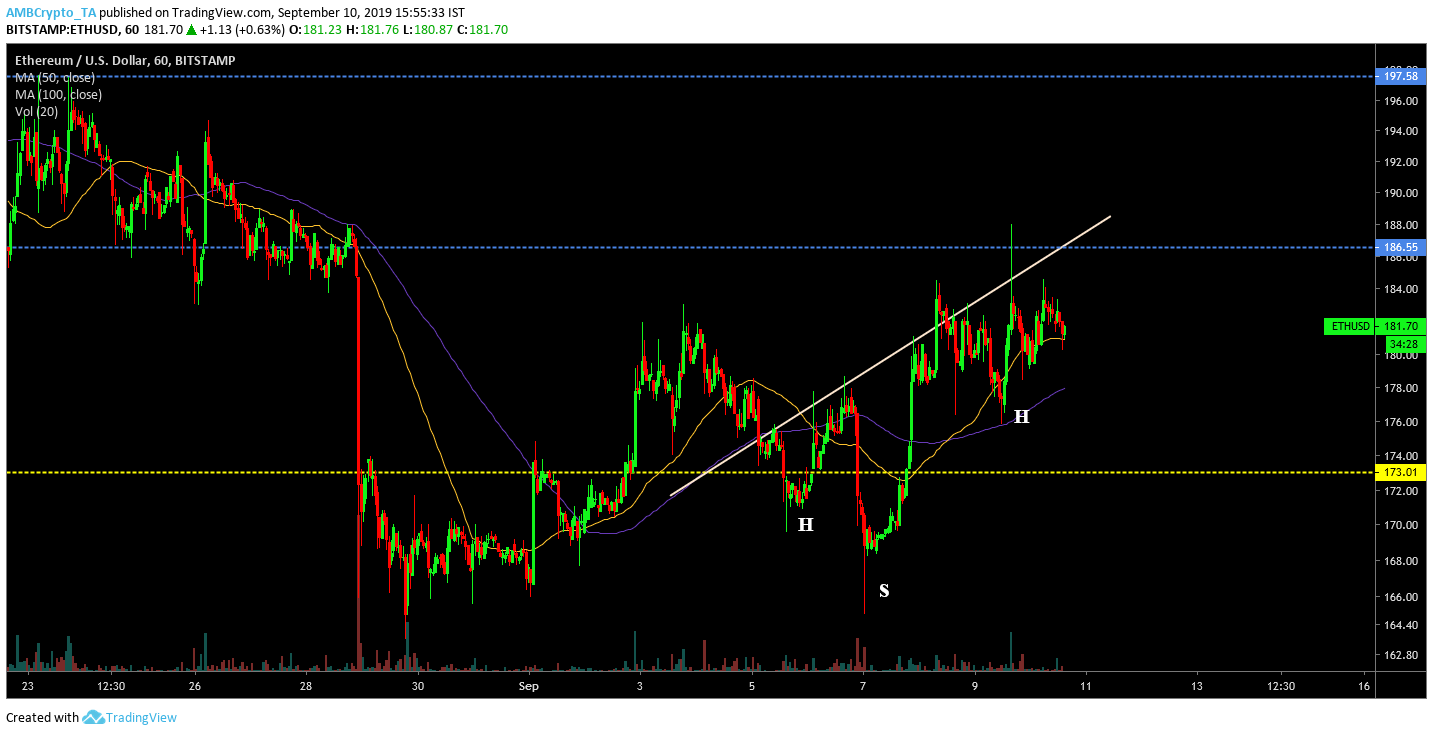
Ethereum 1-hour chart

Source: Trading View
Over the past 24 hours, Ethereum’s [ETH] price has consolidated above the $18o range and continued to make progress after its recent dip below the $173.01 support last week. On the 1-hour chart, a prominent head and shoulder pattern can be seen for Ethereum [ETH] and a possible breach of the neckline in the coming days could initiate a bullish breakout. In the event of a breakout, the price of ETH should retest the immediate resistance at $186.55. The 50-moving average indicated a tell-tale sign of an imminent positive breakout as it completed a crossover with the 100- moving average on the chart.
Litecoin 1-hour chart
Source: Trading View
Since registering a drop below the support of $64.46 on 29 August, Litecoin’s [LTC] price has registered a steady growth over the past 10 days. The coin was valued at $70.83, but was exhibiting a bearish trend, at press time. Litecoin’s valuation indicated the formation of an ascending channel which was initially breached, but the price adhered to the pattern at the time of analysis.
A bearish breakout was on the cards for the coin before it marched on to another bullish run. A predicted breakout could see the price retest the immediate support at $68.43. If the breakout is sustained with high bearish momentum, the price may slump down to $66.72 or $64.46 as well, before embarking on a recovery.
The depreciating volume also suggested a bearish diversion and MACD completed a bearish crossover on the chart.
XRP 1-hour chart
Source: Trading View
XRP’s price hit its yearly low valuation of $0.2455 on 2 August this year. At press time, the token had undergone recovery, but the short-term chart indicated further uncertainty. The 1-hour chart pictured the formation of a symmetrical triangle pattern, opening up the possibility for both bullish and bearish breakouts in the charts. A possible bullish break could push the price to test the valuations at $0.264 and $0.266, whereas an outbreak downwards could see it decline down to the supports of $0.253 and $0.250.
The indicators remained contradictory to each other as the MACD approached a bearish crossover, whereas the Moving Averages completed a bullish one.
Tron 1-hour chart
Source: Trading View
Justin Sun’s Tron [TRX] witnessed a massive drop to $0.013 on 7 September, but the asset acted quickly to recover its valuation. The current price was progressively growing, but an ascending wedge formation suggested that another bearish pull awaited the 13th ranked crypto. Tron [TRX] was approaching the long term resistance at $0.016, but the predicted drop should see the price crash down near the immediate support of $0.0152. The decreasing volume conformed to the pattern as a bearish pullback awaited the token.
The Relative Strength Index or RSI suggested decreasing trade interest and the token slowly navigating towards the oversold section.
Monero 1-hour chart
Source: Trading View
Monero [XMR], the only privacy coin in the list of top 10 cryptos, experienced a drop to $71.5 on 4 September. Following a recovery, its valuation dropped down to $74.84 again. However, the current price movement was laced with bullish sentiments. At press time, Monero [XMR] indicated the formation of a descending channel. The pattern suffered a breach but it was bearish in nature, suggesting a fakeout. The imminent bullish breakout was yet to surface in the charts.
The Fibonacci retracement lines suggested the price should re-test the immediate resistance at 73.62 following the breakout, and greater bullish momentum could see the valuation surpass resistances at $75, $76.01, and $78.50.
