Ethereum could push above $305 before March as golden cross emerges

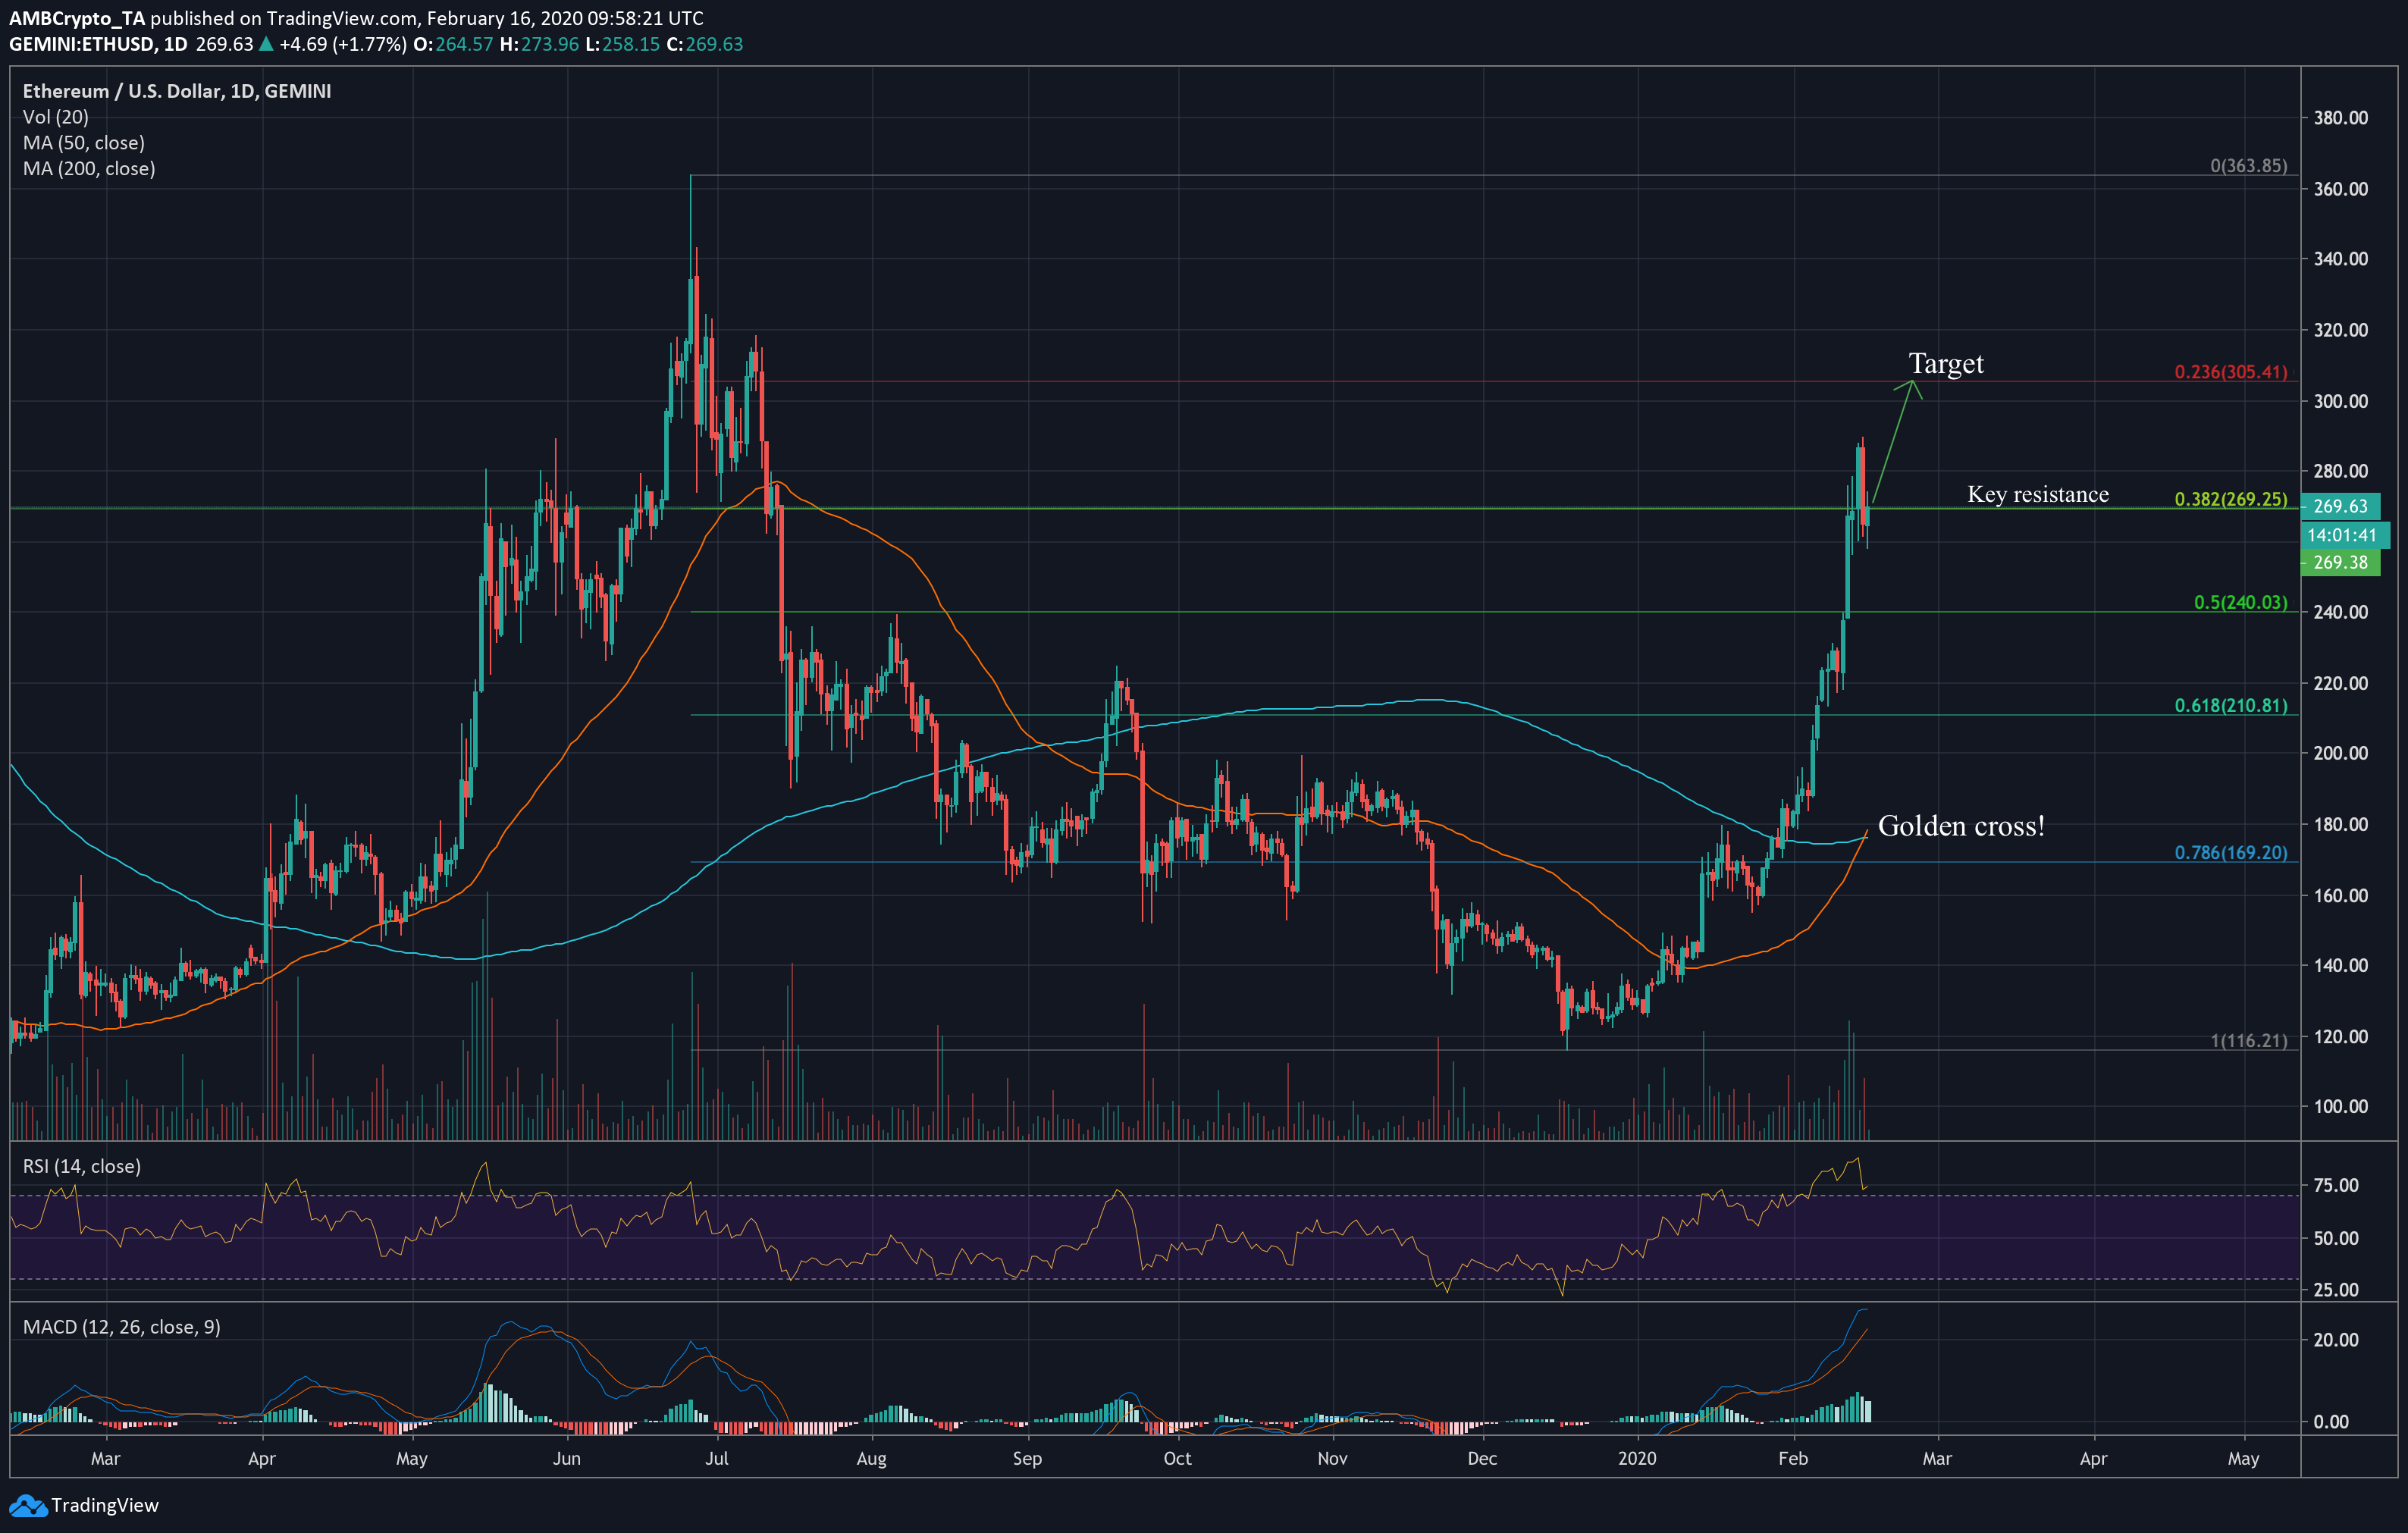
Despite excellent gains this year, the looming death cross that Ethereum has been facing runs through the minds of concerned investors since September last year. However, the increasing fear that ETH’s 130% appreciation this year could come crashing down can now be put to rest, as the 50-day moving average has finally crossed over the 200-DMA.
According to CoinMarketCap, Ethereum has a market capitalization of $29.87 billion, with $24 billion worth of ETH traded in the last 24 hours.
Ethereum 1-day chart

Source: ETHUSD on TradingView
The flagship Ethereum coin has been stretching its neck up this month, exhibiting a nearly 54% increase since February 1. Though a brief corrective move took place yesterday, on February 15, ETH still looks to be extremely bullish, and will likely push up further in the days to come.
The 1-day chart showed strong support at the 38.2% Fibonacci retracement line, meaning ETH will find it difficult to pull under $256 in the near future. The 50 and 200-day moving averages posited an extremely bullish argument for the Ethereum coin, having moved into a golden cross during the correction one day prior. With both the MAs moving under the price, we could see some explosive movement from ETH in the next week or so.
MACD also predicted appreciation, with the signal line moving well under the MACD line, at the 20.0 mark. The Relative Strength Index (RSI) indicated an overbought market. However, this hasn’t prevented ETH from appreciating despite spending multiple days above the 70.0 mark over the last few days. With RSI appearing to be collapsing, a corrective move could be incoming, followed by further appreciation.
With technical indicators presenting such strong bullish signals, and trade volumes rising, it is likely Ethereum will see upward price movements over the next week. Considering the 38.2% Fibonacci retracement line at $269 was instrumental support when ETH was at its 2019 high in June, a push above this level could see a movement to above $305 before the month is up.
Volatility

Source: CoinMetrics
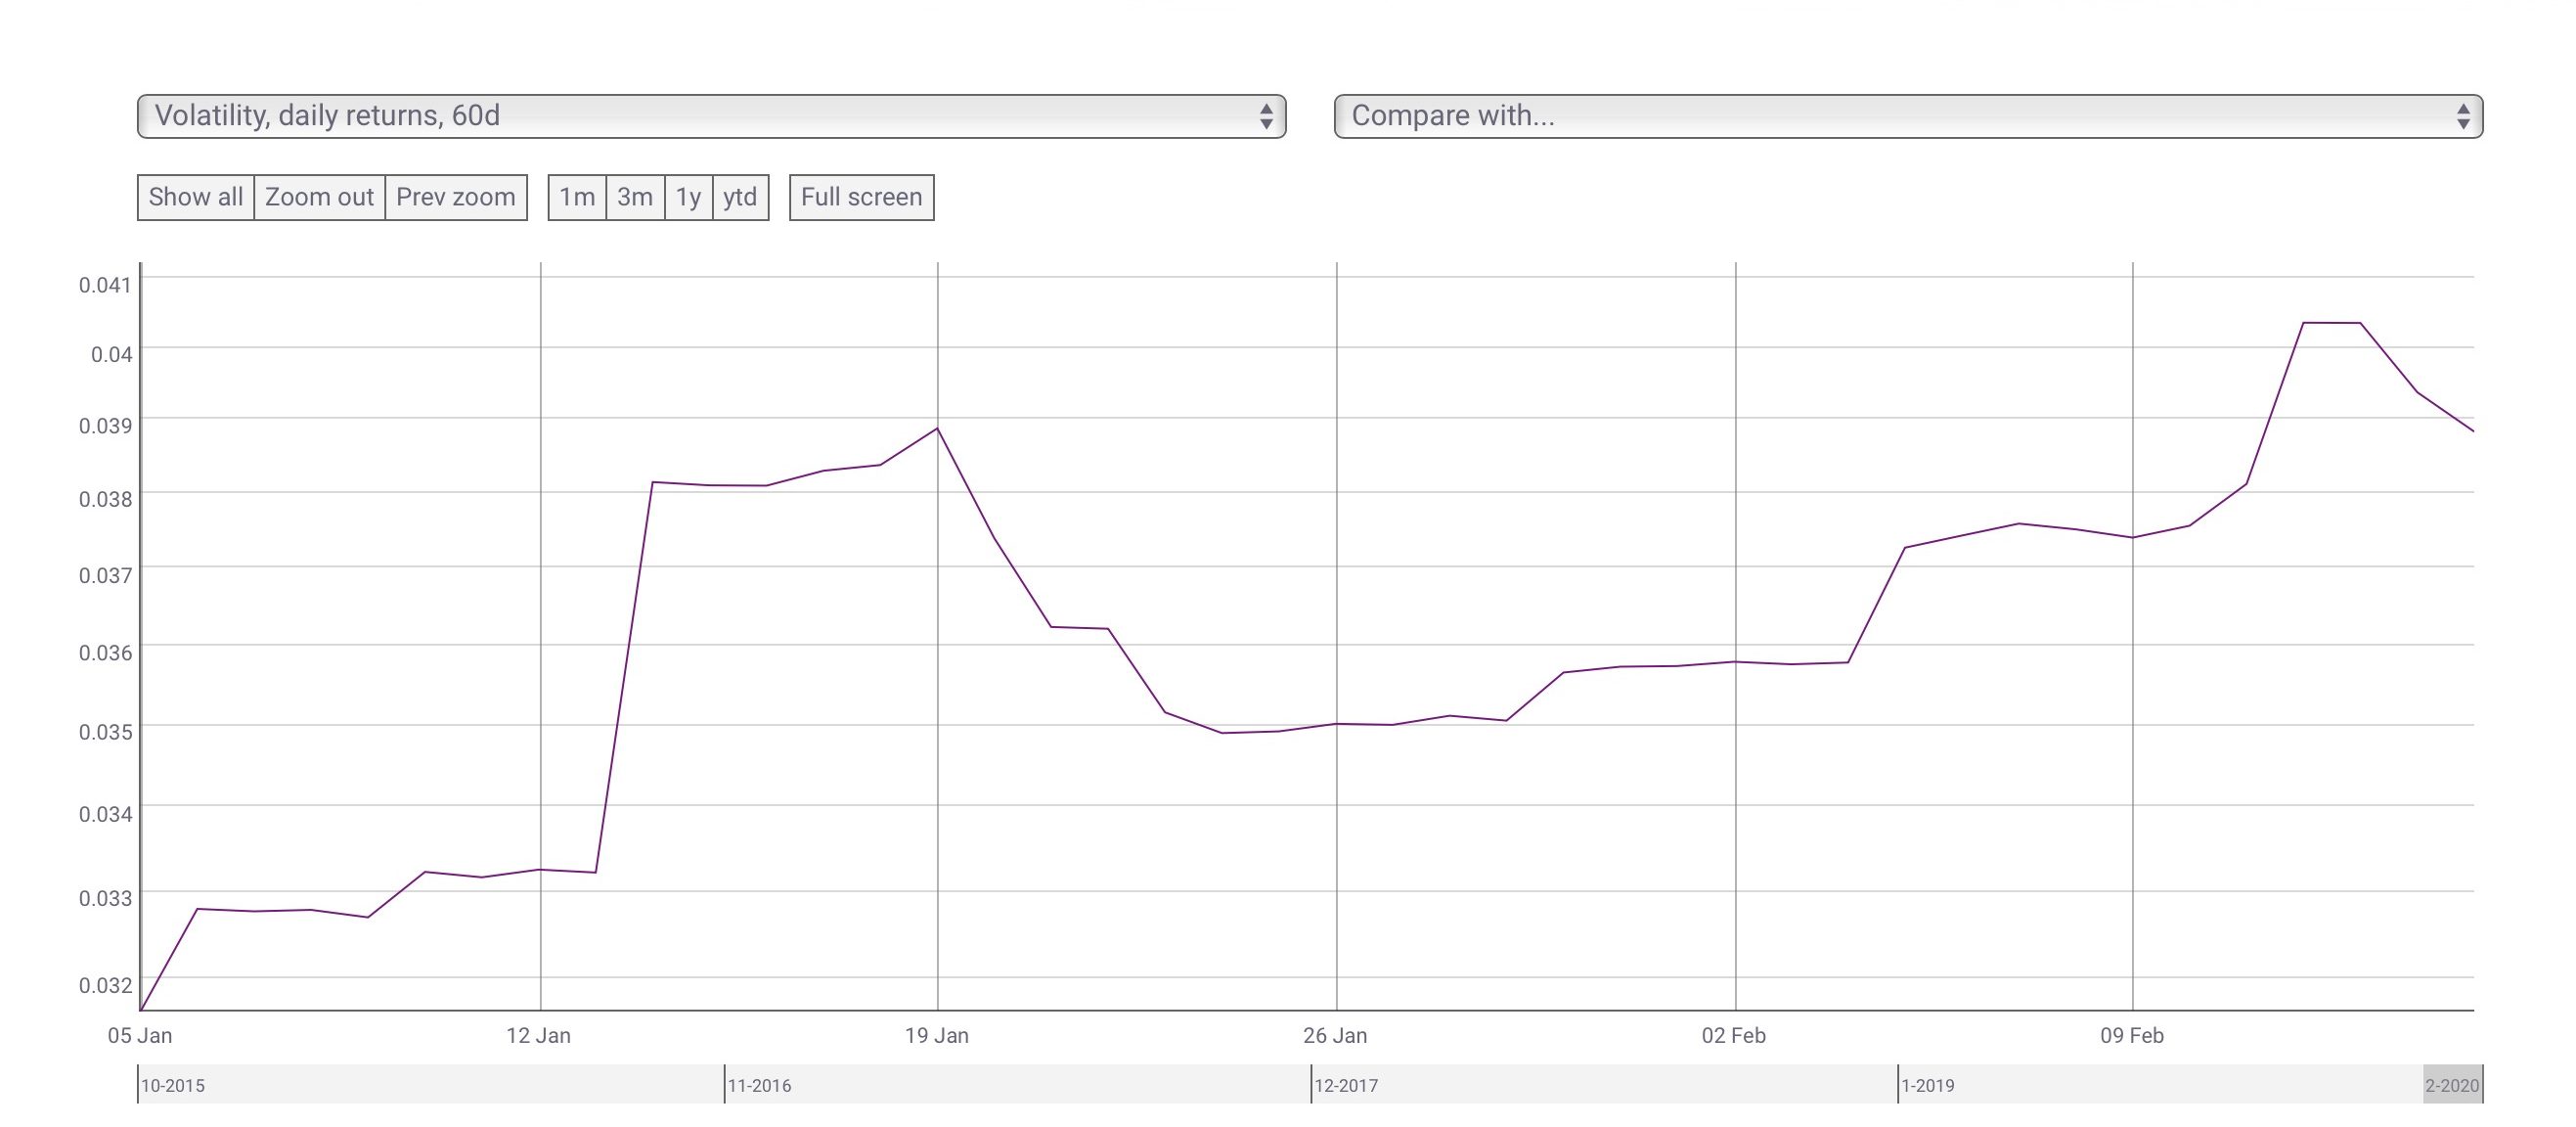
Data from blockchain analytics firm, CoinMetrics, shows Ethereum’s volatility based on 60-day returns has been rising since the start of the year. Starting January at just 0.032, volatility touched 0.04 this month, dipping under 0.039 just days ago. This heightened volatility could enable larger swings in ETH’s movements in the short to medium-term.
Conclusion
The golden cross alone should be enough to determine that Ethereum is likely to move up in value over the next week. This, combined with bullish signals reported from MACD and RSI also support the idea of short to medium-term price appreciation. With volumes on the rise, a push above the key 38.2% Fibonacci retracement line at $277 could facilitate a pump to above $305 before March arrives.


