Ethereum chucks the CUP; bullish breakout may break the handle

Ethereum is nearing the edge, and the CUP might be the first to fall off.
The second largest cryptocurrency in the market has turned over a new leaf. Intrinsic community and technology developments aside, from a price perspective, Ethereum has had a bullish few days. Beginning the week with a massive green rally with fellow altcoin heavyweight XRP, the two led the market with double digit gains.
Not letting the rally be a one-off and allowing correction bears to take over, Ethereum is holding on, even as Bitcoin’s price descends into four digits. Trading at $208 at press time, the coin is just $8 off its peak during the current bullish cycle. Given how the charts have been laid out, this breakout could be the start of something special for the altcoin.
SHORT TERM

Source: TradingView
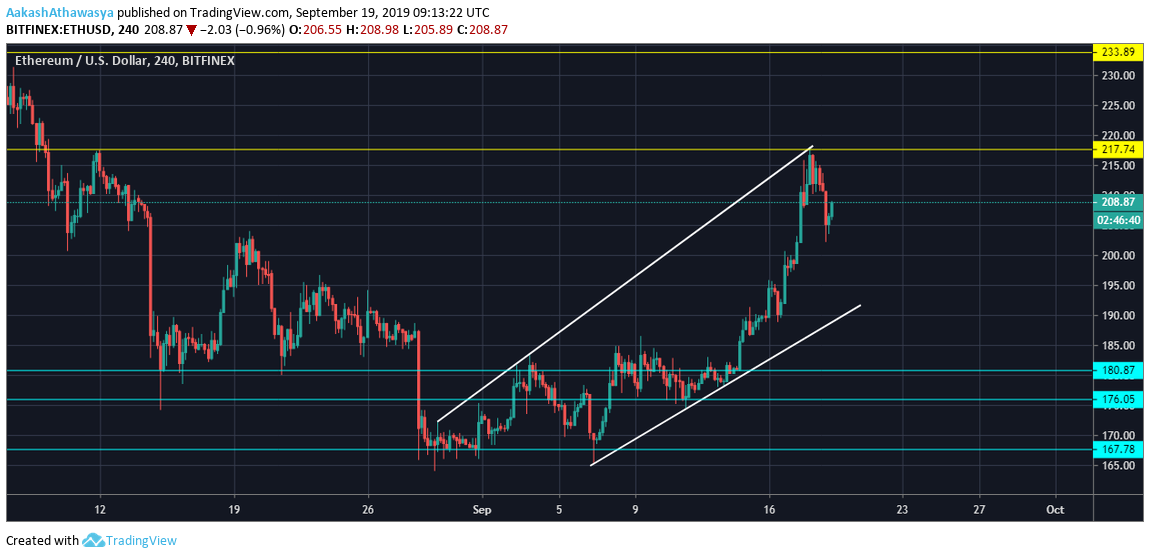
A clear parallel channel is being formed, and it is on the ascent. Following the recent rally, coupled with strong fundamentals emanating from the coin’s network activity, the channel looks to persist.
There is although, an absence of a consistent array of higher-highs, and the higher lows are stacked. Placed at $168, $175, $180, and $190, the coin has been yo-yoing, but has managed to move higher with every downward movement. Looking down, the closet support level lies at $180, which barring a massive sell-off, looks unlikely to be tested. Looking up, things get interesting. Ethereum, during the recent upswing, bounced off the resistance level placed at $217, which the coin is not too far off from, despite dropping below $210.
Finally, in the short term, the level of $233 is also significant, as the price bounced off the same on three occasions: 15 July, 25 July and 6 August. In over two months, ETH’s price has not crossed this margin. Hence, a move over $217, coupled with strong technicals, could buoy the market over $233.
LONG TERM

Source: TradingView
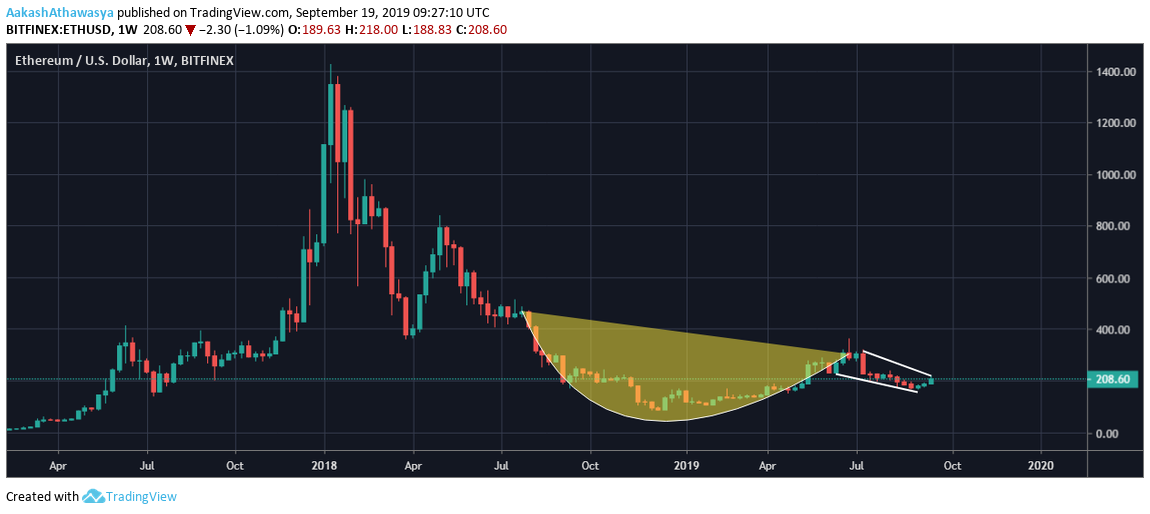
In the long term, Ethereum seems to be breaking out in a very stark fashion. An initial look at the 1-week ETH chart reveals a vague, but present formation of a ‘CUP,’ created due to the bearish movement of 2018, preceding the bullish [relatively] 2019.
The left cup lip began in July 2018, and sparked a price valley, thanks in large part to the crypto-winter which took the collective market cap to $100 billion from over $800 billion earlier in the year. In 2019, bullish sentiment took over the market, and the coin’s price surged from $80 to over $320 in June, the top of the right lip. July and August began to see slumping movement, more drizzle than downpour, leading to the formation of a parallel channel, or a handle.
Despite sustaining itself within the channel, the recent price surge, if sustained through the end of the month, could lead to the handle being broken. The handle, at press time, marks a resistance of $221, and a move out of the same could result in a breakout from the handle and imminent bullish movement.
To conclude, the key resistance levels are placed at $217, $221, and $233, the first and third based on the movements in July and August, and the second owing to a surge out of the ‘Cup and Handle’ formation.
However, a simple breakout over the same will not be easy for two reasons. First, earlier this month ETH broke into its ‘Death Cross,’ spelling bearish movement and second, Bakkt is launching its physically delivered Bitcoin Futures next week, a development which could lead to a shift from altcoins to the king coin once again.


