Altcoins
ETH, LTC, TRX, ADA, XMR Price Analysis: 12/09

Over the past 24 hours, Bitcoin [BTC] witnessed a minor hike of 1.02 percent but the rest of the alts collectively declined. The prices were going down according to coinmarketcap.com and the trend appeared bearish for the other assets. At press time, Bitcoin [BTC] dominance was above 70 percent again, clocking it 70.3 percent.
Ethereum 1-hour chart

Source: Trading View
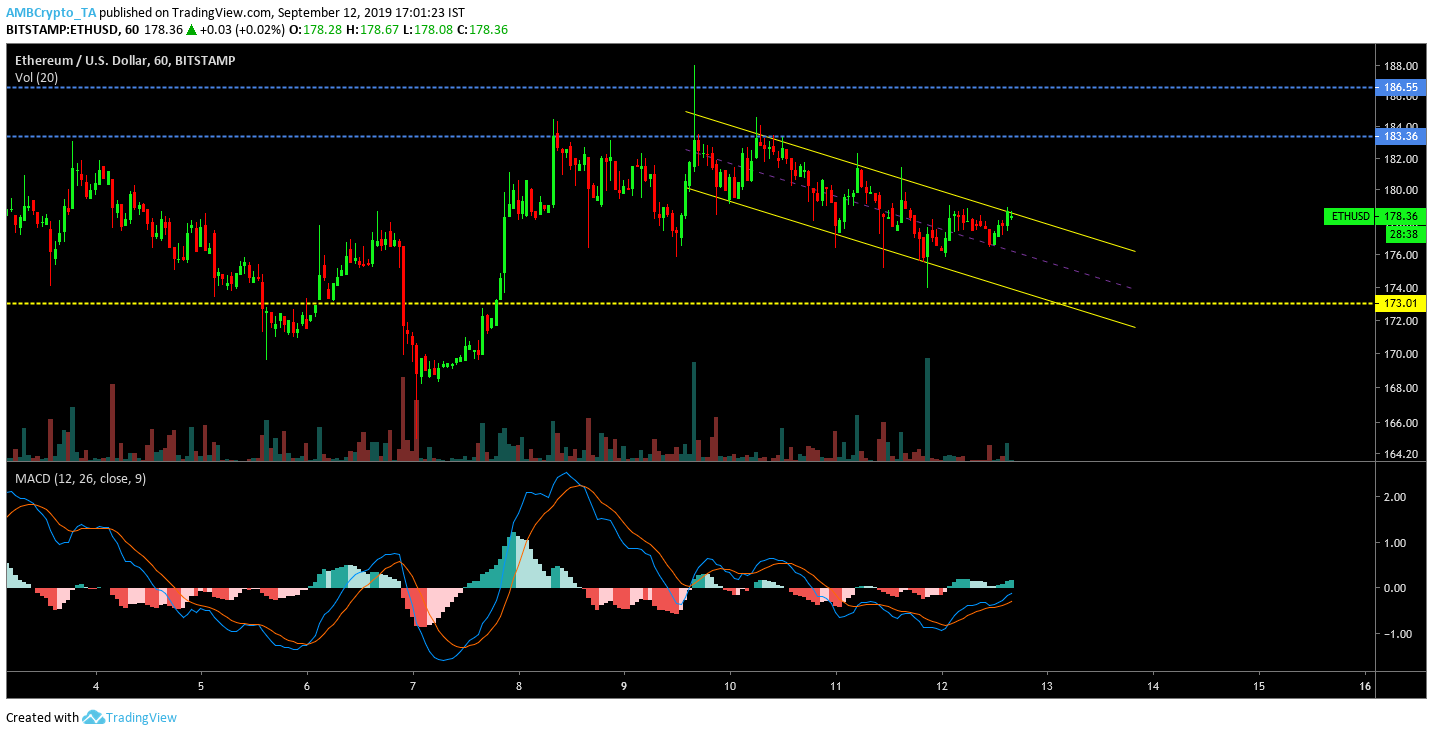
Ethereum’s [ETH] price dipped under the $170 valuation on 6th September but the valuation breached resistance at $173.01 again and since then, the price consolidated above it. At press time, ETH’s value was under the $180 mark but an imminent bullish breakout was on the cards. The formation of a descending channel pattern indicated the price should retest immediate resistance at $183.36. Previously, the price bounced off the same line thrice, as the resistance at $183.36 held strong.
MACD remained bullish for Ethereum [ETH] as well but the trading volume failed to indicate a clearer picture.
Litecoin 1-hour chart
Source: Trading View
Litecoin [LTC] resonated a similar trend as a prominent descending channel was evident in the charts. Litecoin’s [LTC] price exhibited strong sideways movement between support at $68.43 and $71.05 before the resistance was breached on 10th September. A pullback brought it below the resistance again, but pattern formation at press time suggested another bullish break should surface in the next few days. The immediate resistance remained at $71.05 while strong bullish momentum may see it re-test resistance at $72.92 as well.
The decreasing trading volume confirmed validity of the descending channel pattern.
Tron 1-hour chart
Source: Trading View
From 8th Sept to 10th Sept, Tron’s [TRX] price movement navigated within the rising wedge pattern and awaited a bearish breakout. The breakout surfaced on 10th Sept itself, as the price slumped down to $0.0143 breaching major support at $0.0151. There were positives to be taken away from the fall as the price exhibited another descending channel formation. However, the price may face strong resistance at $0.0151 before re-testing the resistance at $0.016.
The possibility of a bullish surge was further improved by observing Relative Strength Index, which was on a sharp incline after dropping below over-sold section. The last time Tron [TRX] dropped below 30-line mark was on 7th Sept after which the valuation went on a bullish run.
Cardano 1-hour chart
Source: Trading View
The Cardano [ADA] chart had contrasting indicators at press time. The price has been on a decline over the 48-hours but the valuation was forming a falling wedge pattern which was nearing completion. ADA should witness a bullish pullback over the new few days but the Relative Strength Index did not support the imminent break.
The 50-moving average and 100-moving average also completed a bearish crossover which reduced the possibility of a bullish pullback.
If a bullish breakout does pan out, the price should re-test the resistance at $0.045 before approaching resistance at $0.048. Another drop may see the price retest the support at $0.043.
Monero 1-hour chart
Source: Trading View
Monero’s [XMR] 1-hour chart exhibited the predicted bullish breakout following formation of a descending channel. However, the momentum behind the breakout failed to breach past resistance at $73.97 and consolidated under it. At press time, there was an absence of substantial trend pattern as the price consolidated below the resistance. 100-moving average completed a bearish crossover with the 50-moving average and continued to diverge away in the charts.
The immediate trend remains neutral for XMR at press time but it should be more indicative in the next 24-hours.
