Market trends in the crypto-industry seemed to point to a lack of correlation as many of its altcoins courted individuality on the charts. After Ethereum’s recent pullback and Bitcoin’s re-test of the range at $11,900, XRP was able to sustain testing at $0.30 as well. On the contrary, Digibyte had better success over the past 24-hours and STEEM noted some price recovery in the market too.
XRP
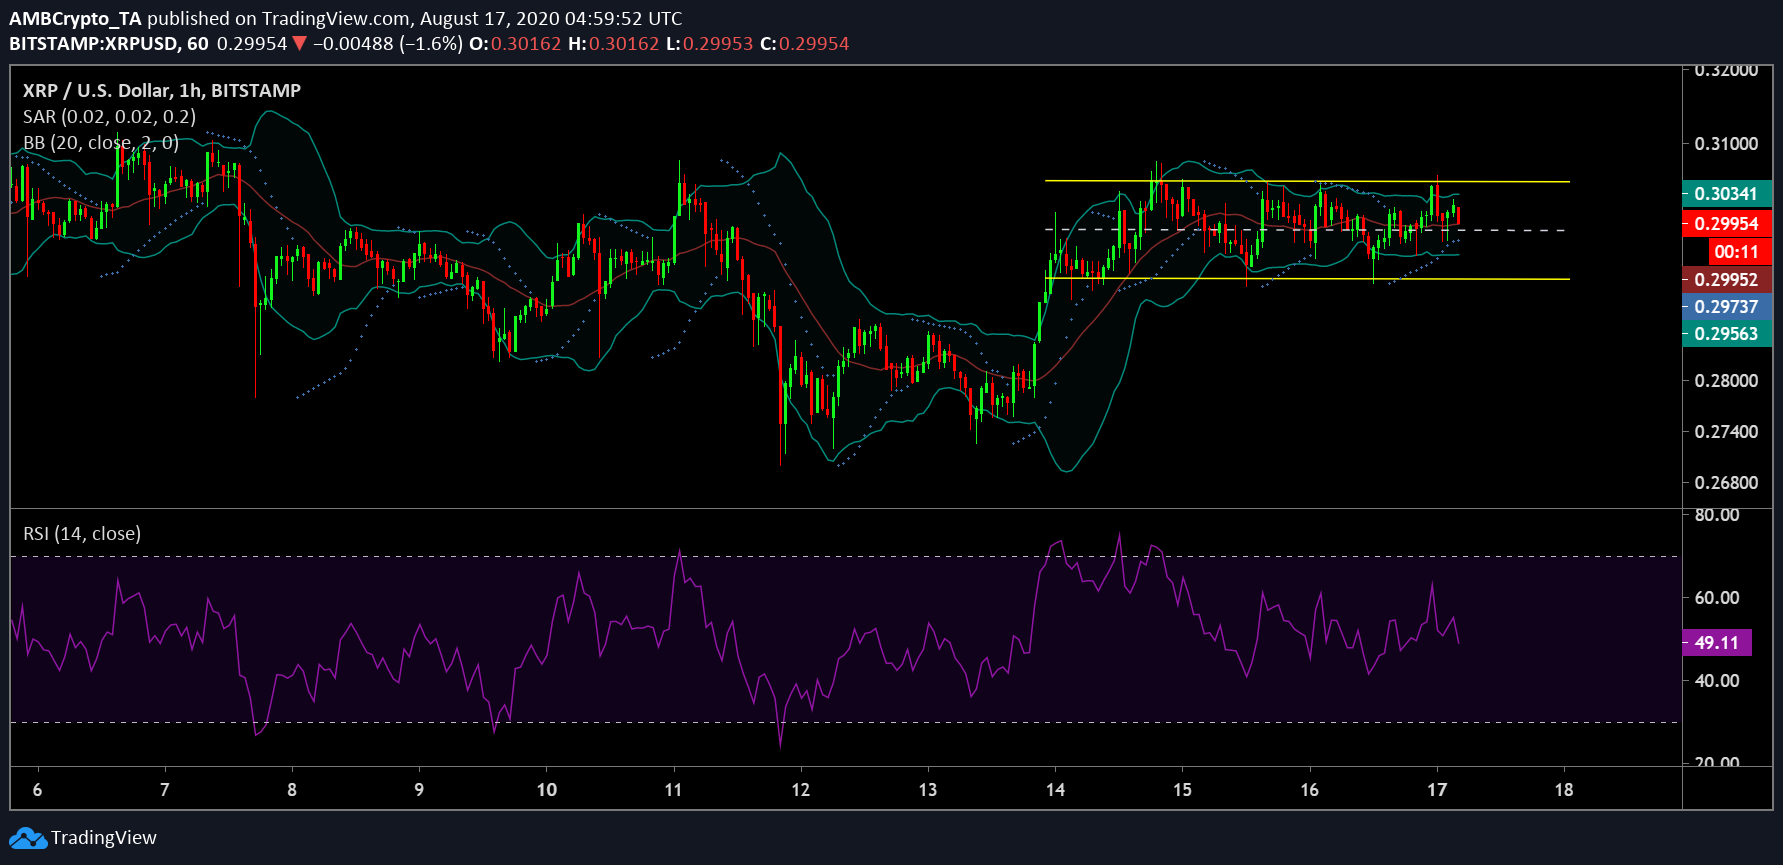
Source: XRP/USD on Trading View
For XRP, sideways movement was clearly evident on the charts since the consolidation between $0.303 and $0.2956 continued to keep the market busy, at press time. The market cap of XRP registered a total value of $13.5 billion with a trading volume of $2.03 billion over the past 24.hours.
Just like the price, XRP’s market indicators remained imperviously neutral. The Relative Strength Index or RSI noted an index rating of 49.11, suggestive of a balance between the buying and selling pressures.
In the meantime, the Bollinger Bands were parallel to each other, a sign of volatility being reined in. However, the Parabolic SAR was bullish for the token, at the time of writing, as the dotted markers appeared to be under the candlesticks.
XRP was one of the few cryptos highlighted in a TV ad by Grayscale Investments recently, an ad that was met by a lot of derisive reception from the crypto-community.
STEEM
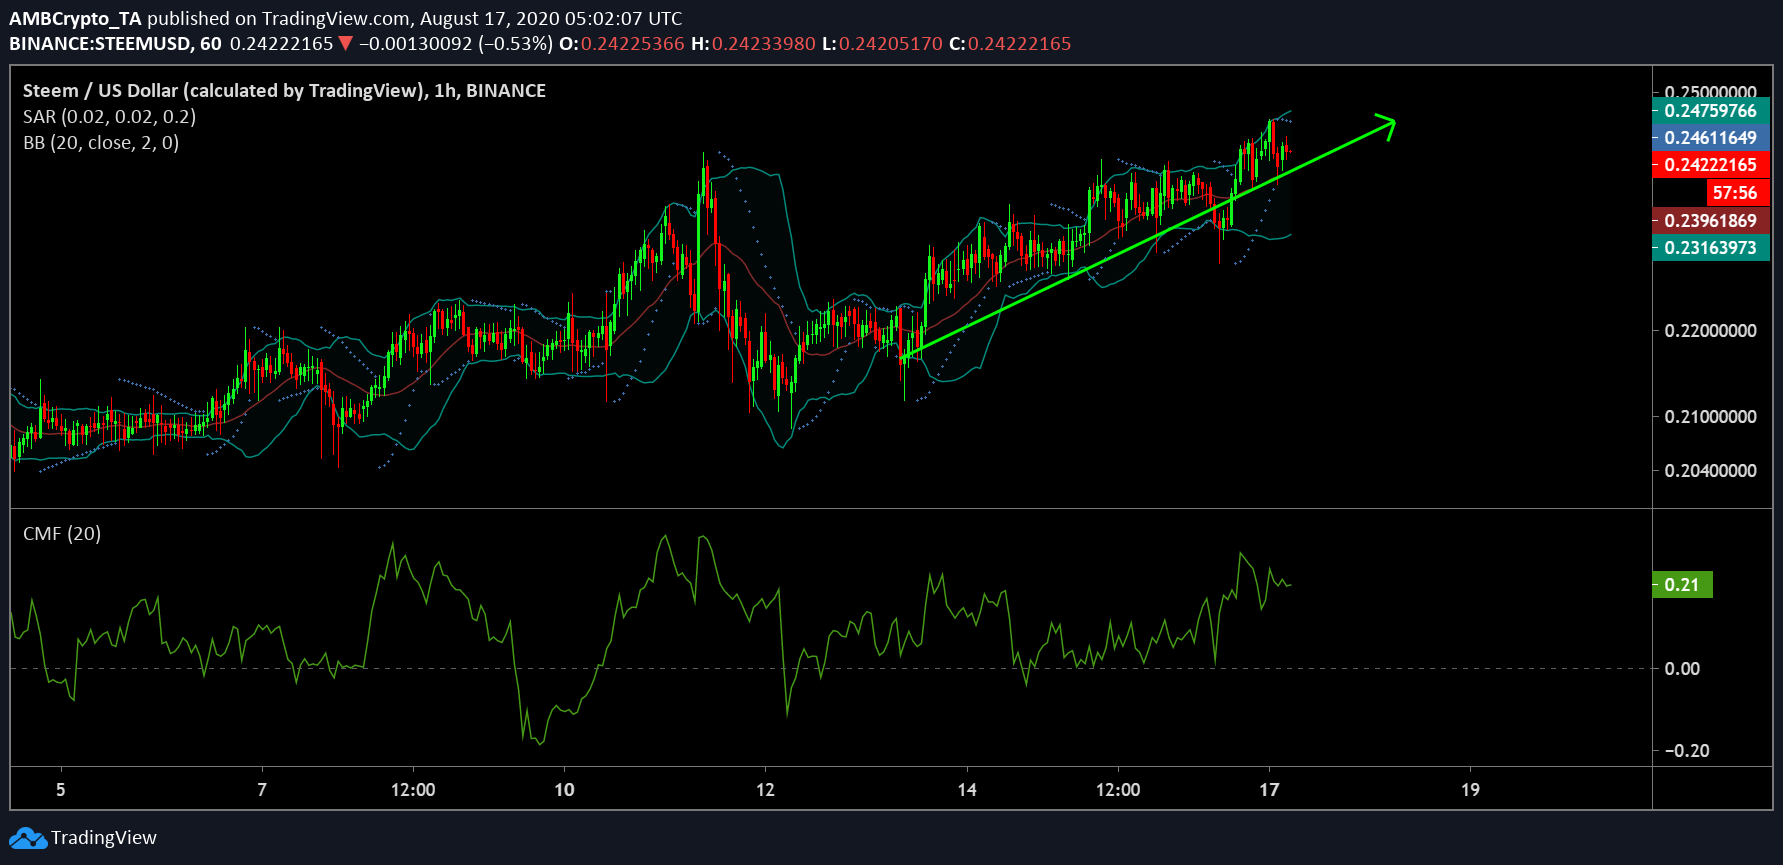
Source: STEEM/USD on TradingView
Despite the fact that it is ranked 113th on CoinMarketCap’s charts, STEEM has been able to curve its way up over the past few days, with its price following a strong uptrend. Noting a growth of 2.43 percent on the charts, STEEM registered a market cap of $89 million, while its 24-hour trading volume was close to $5.5 million, at press time.
In light of community activity and developments in the ecosystem, STEEM’s Chaikin Money Flow or CMF suggested that capital flowing into the market was continuing to outperform the capital moving out of it. In the meantime, the Bollinger Bands were observed to diverge on the charts, a sign of increased volatility, while the Parabolic SAR kept pushing the price north.
DigiByte [DGB]
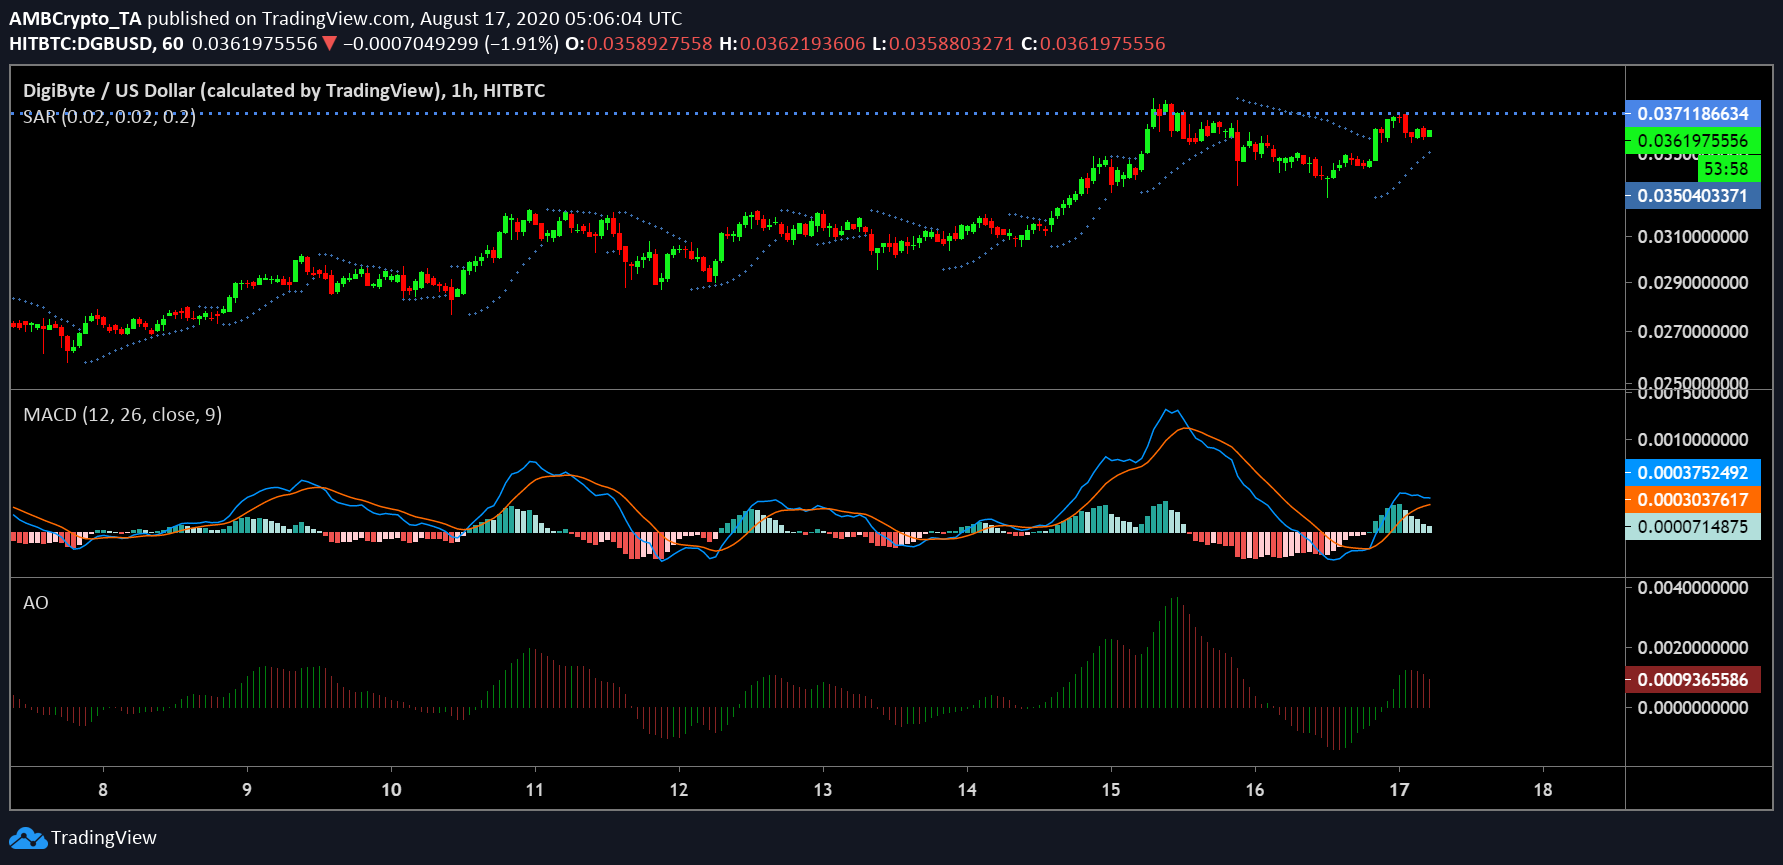
Source: DGB/USD on Trading View
Finally, the 37th-ranked Digibyte continued to sustain a steady rally upwards while registering strong returns of 4.24 percent on the charts. However, its trading volume of $19.74 million over the last 24-hours was weak, with DGB having a market cap of just under $500 million.
With the resistance at $0.037, the possibility of a retracement was lurking around the crypto-asset’s indicators, at the time of writing. The MACD appeared bullish, but the Signal line was rapidly closing in on a reversal. Further, the Awesome Oscillator also pointed to a shift in momentum towards the bears as the red candles filled up the charts.
In the meantime, the Parabolic SAR continued to maintain a bullish picture. This, however, was likely to be short-lived, as per the other indicators.