Decred posts bullish momentum; Dogecoin, XRP on the losing side

Bitcoin’s uptrend was undercut by another pullback which drove the coin’s price to $8,723, at press time. As the king coin’s dominance grew to 66%, the collective market cap stood at $ $242 billion. However, a few alts have also suffered minor losses over the past day attributing to Bitcoin’s.

XRP:
XRP has seen significant growth in the past year. With respect to XRP’s daily volume, the figures rose in Q1 of 2020 from Q4 of 2019 with the average daily volume being at $322.66 million in Q1 2020 versus $187.34 million in Q4 2019.
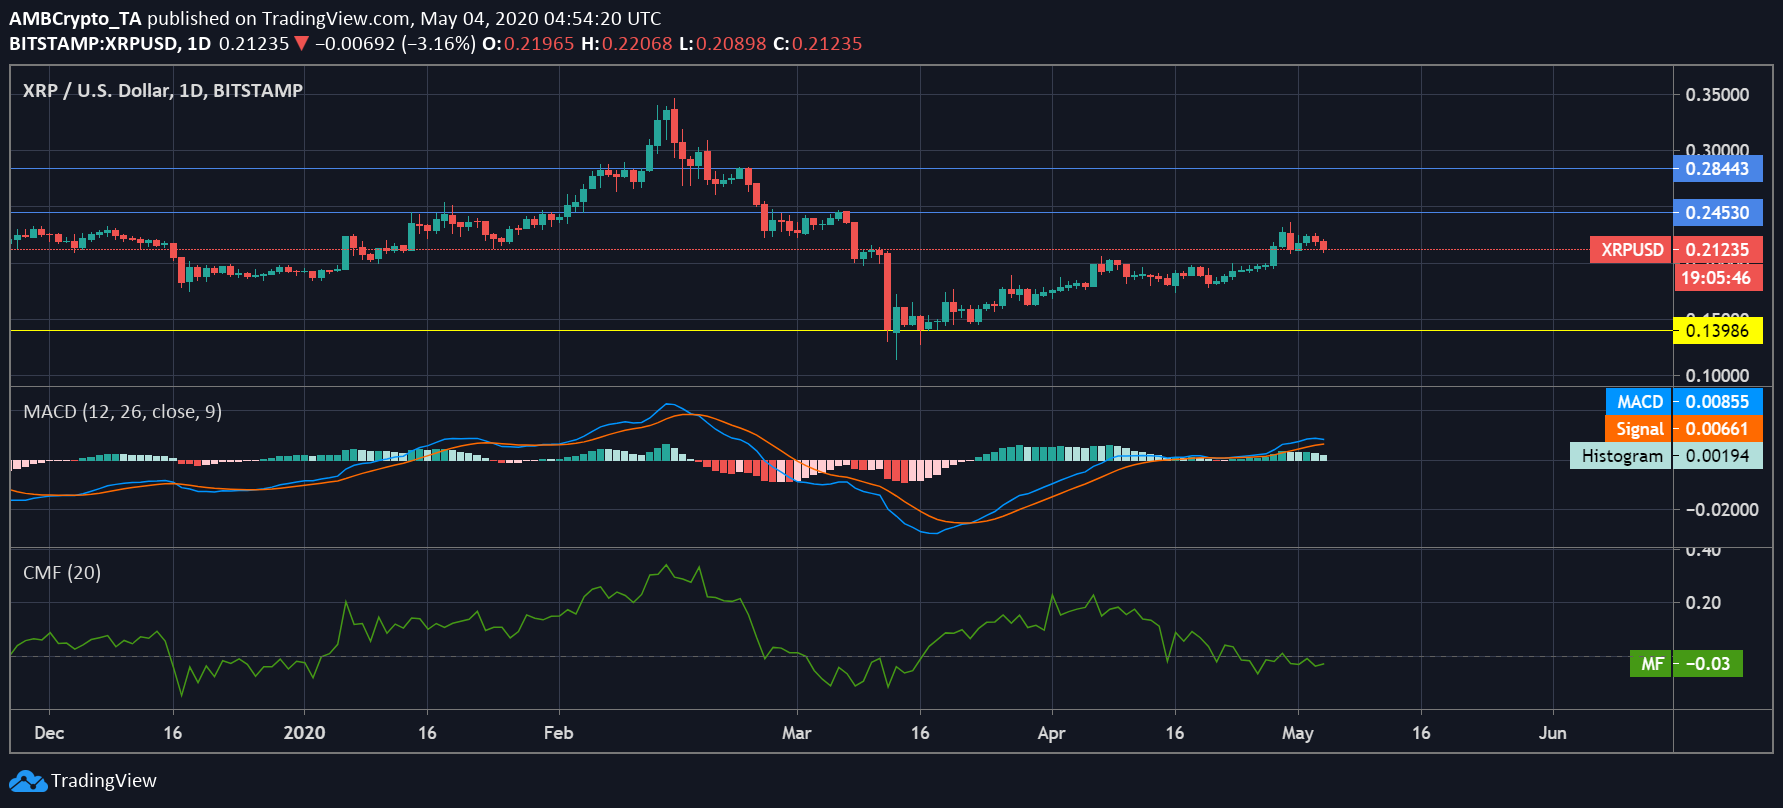
At press time, the third-largest cryptocurrency, XRP, was priced at $0.213 with a market cap of $9.4 billion and a 24-hour trading volume of $2.20 billion. The coin was down by 5.19% over the last 24-hours.

Source: XRP/USD on TradingView
Resistance: $0.245, $0.284
Support: $0.139
MACD: MACD line was above the signal line which indicated a bullish phase for the coin.
Chaikin Money Flow: CMF was in the bearish territory depicting the outflow of capital from the coin market.
Decred [DCR]:
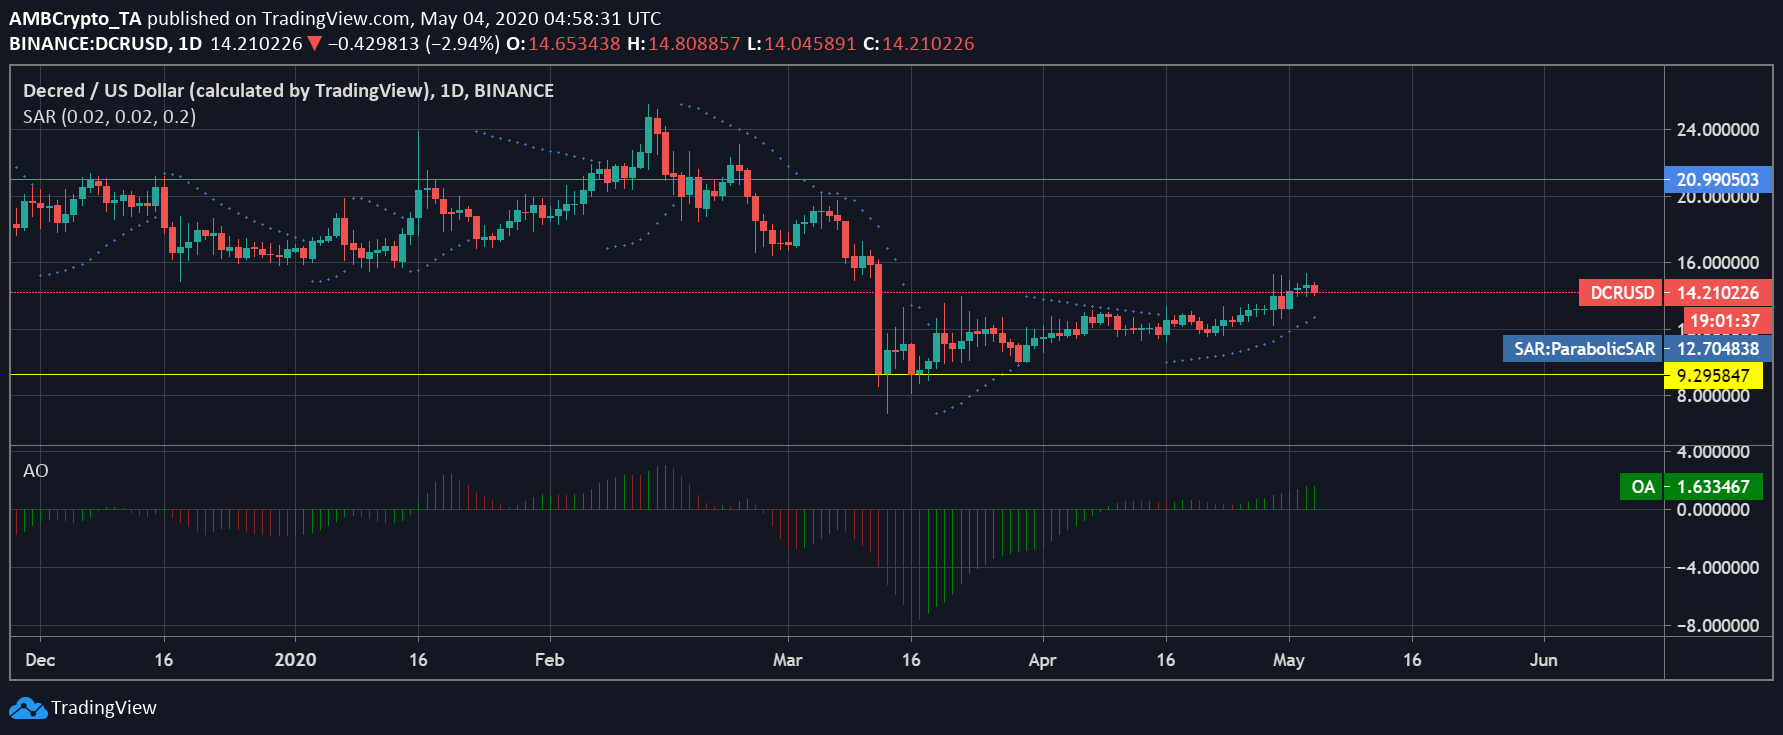
This year, Decred’s technicals appeared to be strong as its active addresses recently hit an all-time high. At press time, DCR recorded a market cap of $162.3 million with a 24-hour trading volume of $109.63 million. After a decline of 4.21% over the last 24-hours, the coin’s value stood at $14.19.

Source: DCR/USD on TradingView
Resistance: $20.9
Support: $9.29
Parabolic SAR: The dotted markers below the candlesticks depicted a bullish trend for the coin in the offing.
Awesome Oscillator: The green closing bars of the AO indicator also indicated a bullish momentum building up for the coin in the near-term.
Dogecoin:
This memecoin has had a tremendous year. However, its price has been struggling since the crash on 12th March. DOGE was priced at $0.0024 after a slump of 4.53% over the last 24-hours. Additionally, it registered a market cap of $304.9 million and a 24-hour trading volume o $264.1 million.

Source: DOGE/USD on TradingView
Resistance: $0.0032
Support: $0.0014
Klinger Oscillator: KO was hovering below the signal line suggesting a bearish phase for the coin
Relative Strength Index: Despite the fact that RSI was in the overbought zone, it witnessed a sharp fall towards the 50-median line depicting a high sell pressure building up in the coin market.


