Analysis
Decred, NEM, Cardano Price Analysis: 31 August

Cardano and Decred were noting bearishness in the near-term. A case for Cardano being able to reverse its downtrend can be made if it were to reclaim the significant resistance level it recently lost. At the time of writing, NEM was registering a retracement after its most recent surge. Decred could be headed further south on the charts if the bearish pressure is maintained since it was moving beneath the long-term moving average as well.
Cardano [ADA]

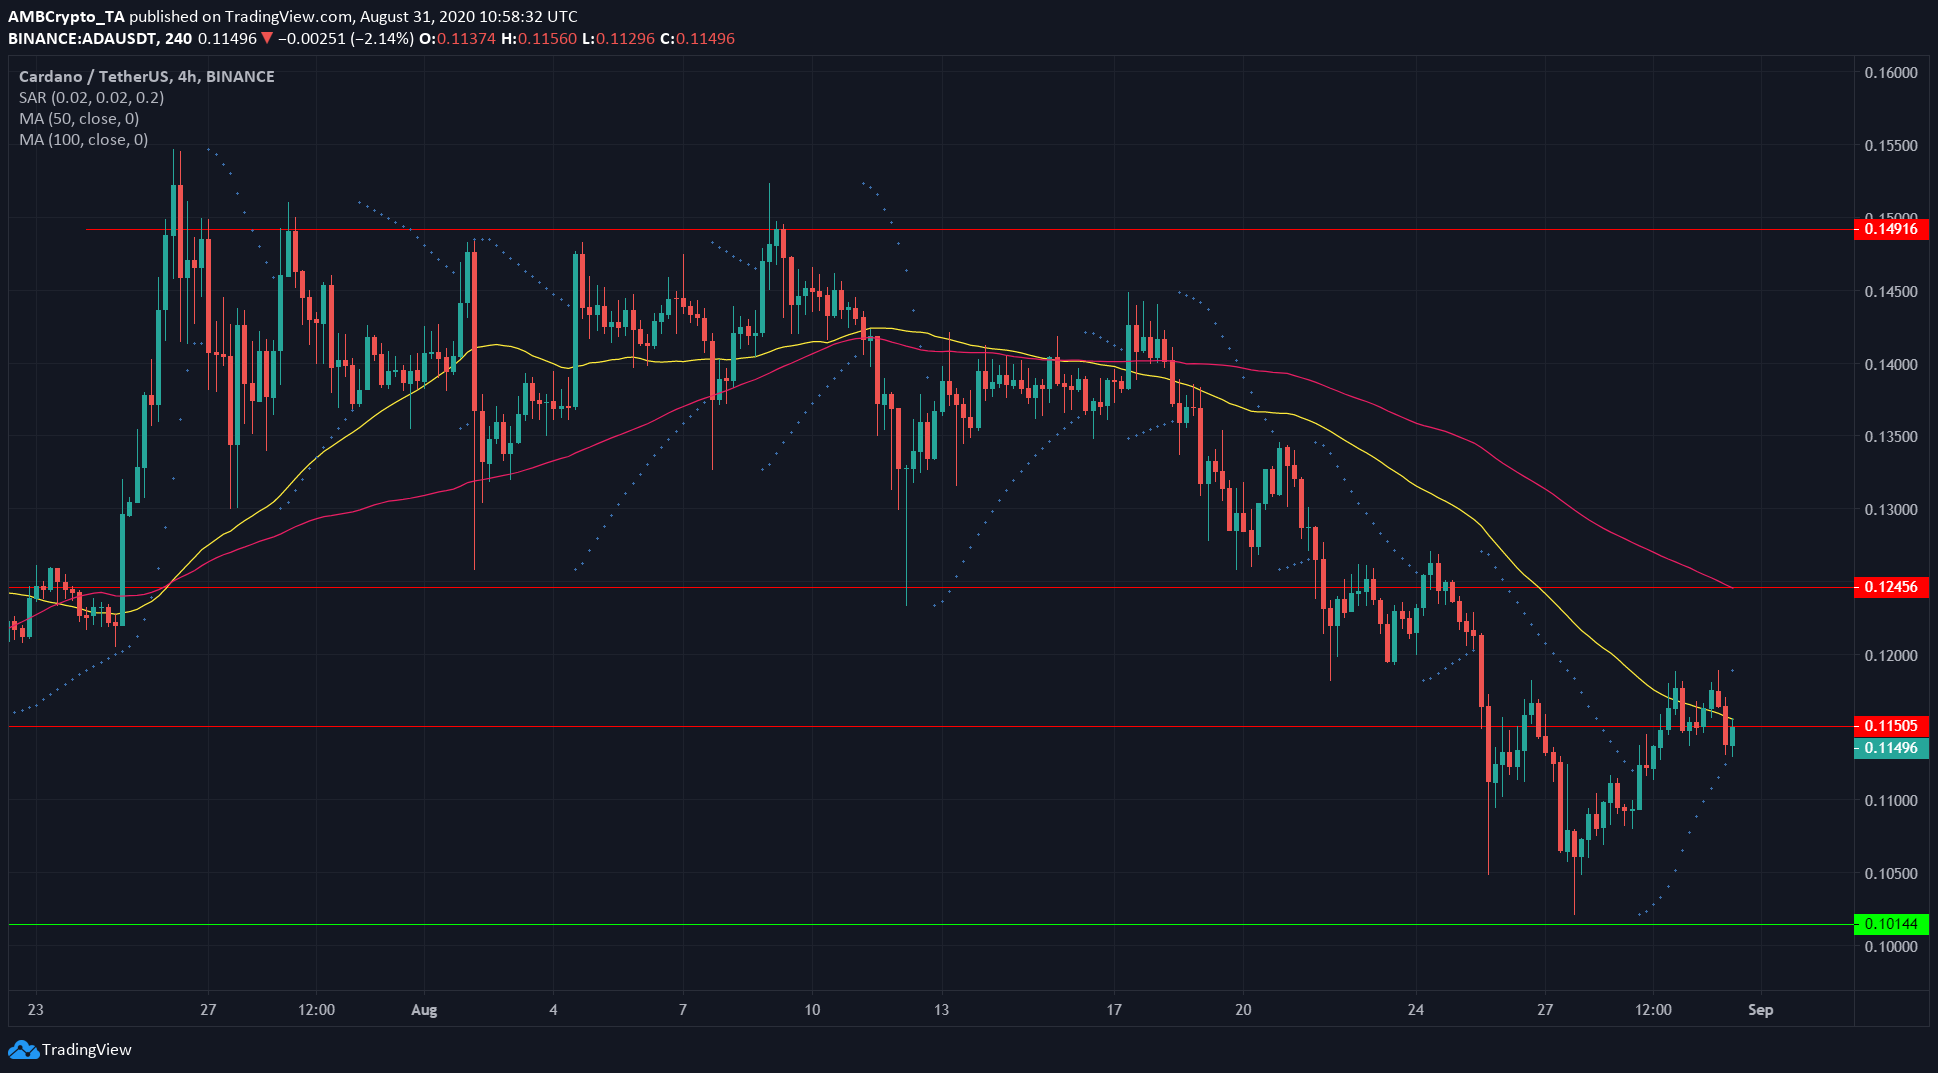
Source: ADA/USDT on TradingView
EMURGO, the blockchain tech giants behind Cardano, recently announced the release of their latest product development, “Oracle Core,” for the development community to work on. This is a step forward in realizing Cardano’s Goguen era, with the same seeking to bring in smart contracts and dApps to the ecosystem.
In the market, however, ADA was caught in a downtrend. The 50 SMA (yellow) had crossed beneath the 100 SMA (pink) to denote a bearish trend. Further, ADA also failed to reclaim its resistance at $0.115, trading above it briefly before sliding back downward. If the resistance were to be flipped, an upside could be possible.
The Parabolic SAR had been rising during its previous move north, but the same soon gave a sell signal as ADA quickly support. For the same, the next support level lay at $0.101.
NEM [XEM]
Source: XEM/USDT on TradingView
NEM, ranked 21st with a market cap of $1.25 billion, surged from $0.046 to $0.158, a move that lasted a month. At the time of writing, XEM was retracing some of its gains, with the crypto trading around the 23.6% retracement level at $0.131.
The levels highlighted by the Fibonacci Retracement tool can be expected to serve as support during XEM’s retracement of its gains.
The Directional Movement Index (DMI) showed a strong bullish trend, with the ADX (yellow) value near 50. It is quite likely that XEM will hit the 38.2% retracement, but its bullish outlook needn’t necessarily change.
Decred [DCR]
Source: DCR/USDT on TradingView
Decred was registering short-term bearishness on the charts as price moved to the lower bands of the tightening Bollinger Bands. Further, the RSI showed a value of 40, having failed to breach the neutral 50 line, reinforcing the idea of a downtrend in the market.
Decred’s price was just beneath the 200 EMA (purple) and could signal a slide in price in the coming days. Its support lay at $16.86 and $15.60.

