Could this move from 1Inch affect Uniswap prices

- Over 400,000 UNI tokens were recently sold off.
- UNI has continued to decline and trades below $5.
The 1Inch Investment Fund obtained Uniswap [UNI] tokens a few months ago and has now chosen to sell its entire holding. Will this have any effect on the UNI trend?
1Inch offloads its Uniswap holdings
As reported by Spot on Chain, the 1Inch Investment Fund sold off its Uniswap holdings on 17th November. The tracked wallet revealed the sale of the entire stash, consisting of 416,924 UNI tokens valued at around $213 million.
The tokens were sold at an average price of $5.11. Interestingly, the wallet had previously purchased some UNI tokens in February, acquiring 299,849 tokens worth around $2 million at an average price of $6.67.
The recent sell-off suggests the possibility of a loss on this investment.
How it impacted the flow of Uniswap on exchanges
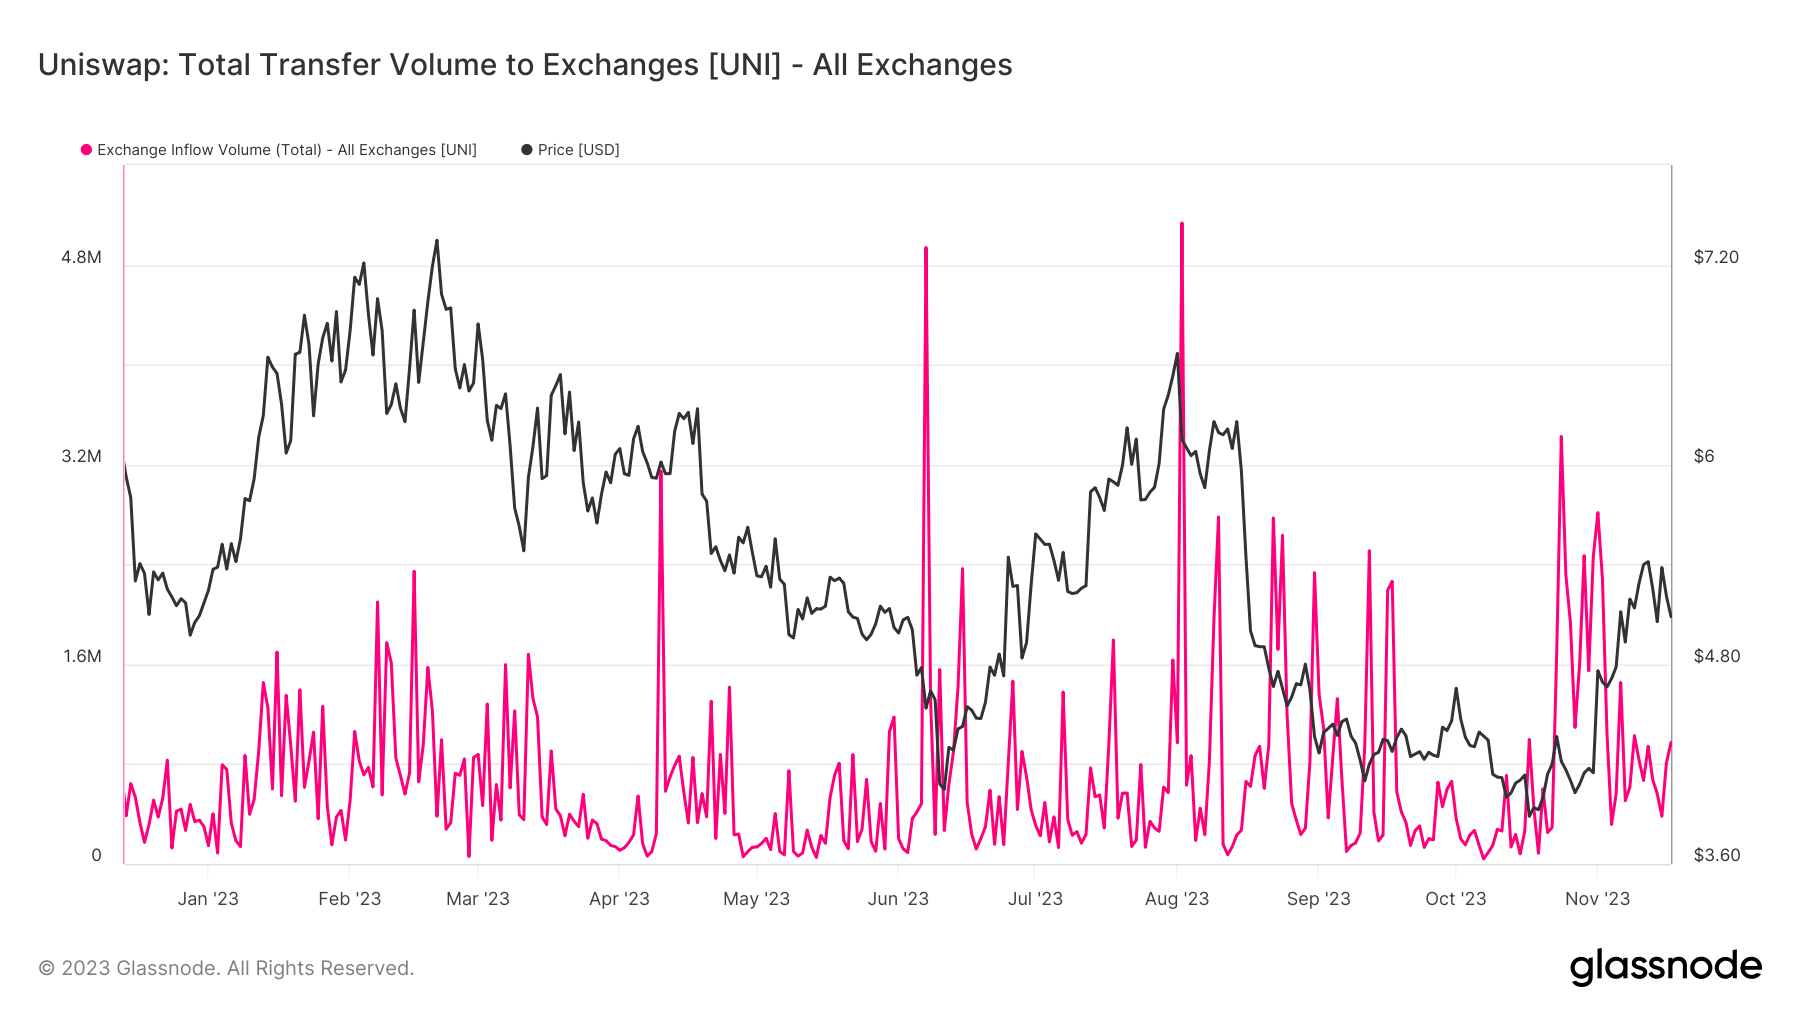
While not reaching the levels observed earlier in the month, the influx of Uniswap tokens into exchanges has recently experienced a noticeable increase.
An examination of the inflow chart by AMBCrypto revealed a discernible uptrend in the volume of UNI tokens entering exchanges. As of this writing, the quantity of UNIs flowing into exchanges was over 973,000.
Also, an outflow analysis indicated that over 803,000 tokens were leaving exchanges. This suggested that the inflow volume was only slightly higher than the outflow.
In other words, there were more sales than withdrawals from exchanges, albeit by a small margin. Notably, the sell-off by the 1Inch Investment Fund did not significantly impact the flow of UNI tokens.
UNI keeps dipping
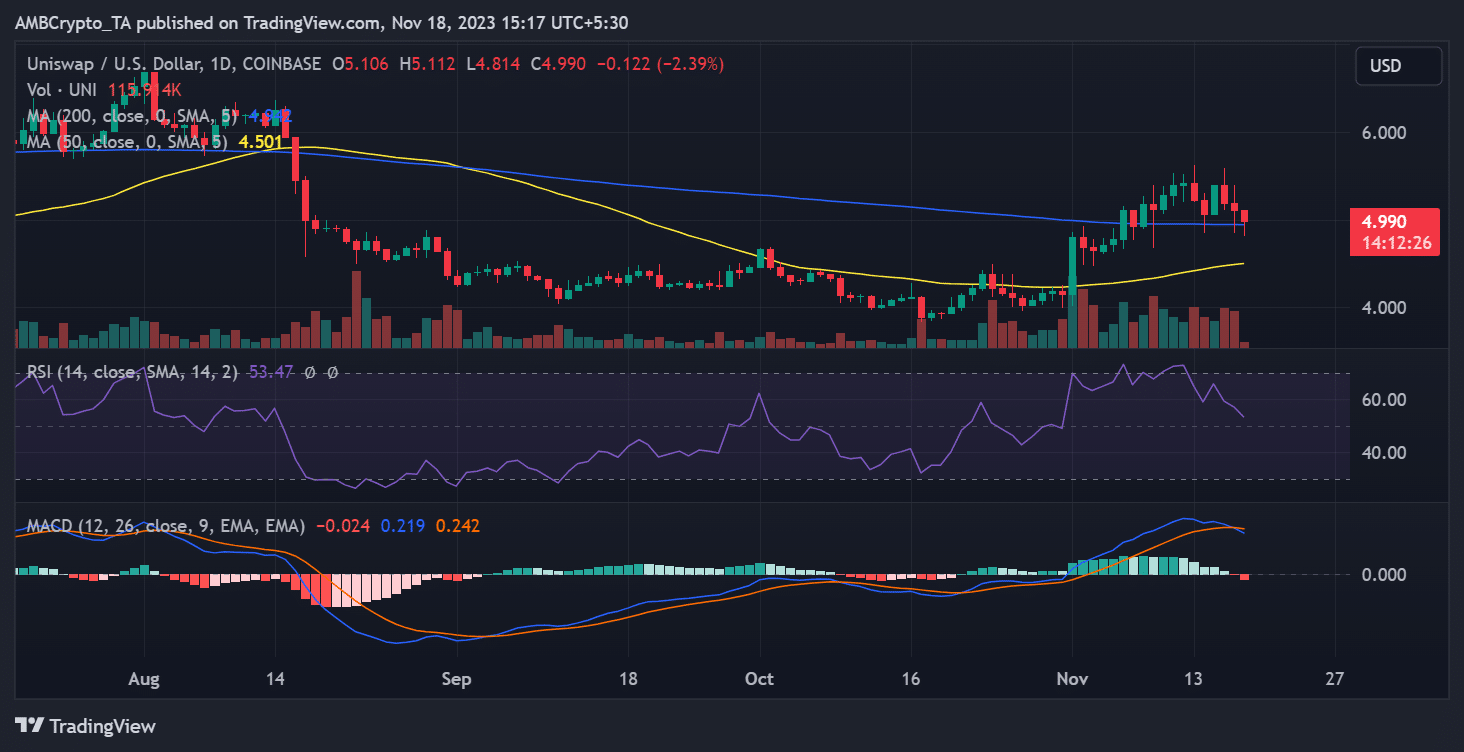
AMBCrypto’s analysis of the daily timeframe chart for Uniswap revealed a persistent negative trend. The chart displayed a continuous downtrend over the past three days.
At the time of this report, Uniswap was trading at around $4.9, reflecting a loss of over 2%. This current decline contributed to a total decrease in value of more than 7% over the last three days.
How much are 1,10,100 UNIs worth today
Additionally, the chart indicated that the price trend was now falling below its long-moving average (blue line). Initially functioning as support, the breach below the blue line signaled a weakening bull trend.
Furthermore, the Relative Strength Index (RSI) corroborated this observation by indicating a decline in the bull trend.


