
Key Takeaways
Chainlink shows bullish signs as whales accumulate, address activity rises, and key support holds. Despite cautious derivatives’ data, momentum may drive LINK toward $22–$26 if current trends persist.
Whales have added over 1.60 million Chainlink [LINK] tokens in the last two weeks, signaling rising confidence from large holders.
This accumulation surge comes as LINK approaches a critical technical juncture, where price action has stalled near a significant support zone.
This accumulation trend mirrors historical setups that preceded rallies, suggesting that institutional conviction may be building ahead of a potential breakout.
The combination of strategic whale activity and key price levels makes LINK’s next move highly consequential.
Is Chainlink preparing for a major rebound after testing key support?
Following its recent rejection near the $20.16 mark, LINK has retraced to retest the $17.39–$15.90 support region.
This zone has historically acted as a launchpad for strong recoveries, and current price action hints at potential consolidation.
Therefore, if bulls defend this zone, a bounce toward $22 or higher may unfold. However, a breakdown below $15.90 would threaten bullish momentum.
The current retest aligns with the recent accumulation spike, implying smart money is betting on a rebound. Traders should watch for volume confirmation and higher lows to validate any recovery setup.

Source: TradingView
Can address growth signal a rising wave of retail interest in LINK?
Chainlink’s address activity has picked up noticeably, reinforcing bullish undercurrents. Over the past week, New Addresses jumped by 19.96%, while Active Addresses grew by 8.20%, at press time, suggesting a renewed influx of users.
Zero-balance addresses also spiked 20.02%, which may reflect wallet creation and onboarding. These trends suggest growing grassroots adoption and reflect a broader interest in LINK despite the price correction.
When combined with strong whale activity, rising address metrics add a supportive layer to the narrative of accumulation and potential price recovery.

Large transaction data revealed a 7.78% increase, aligning with the narrative of rising institutional activity.
These transactions often signal strategic moves by entities managing significant capital. The accumulation pattern, paired with this surge, implies that LINK is gaining traction among high-value players.
While the price remains below recent highs, the underlying network activity suggests a buildup phase rather than distribution. Therefore, growing whale footprints and large-scale transfers add weight to the bullish thesis.
Do derivatives metrics hint at hidden caution behind bullish sentiment?
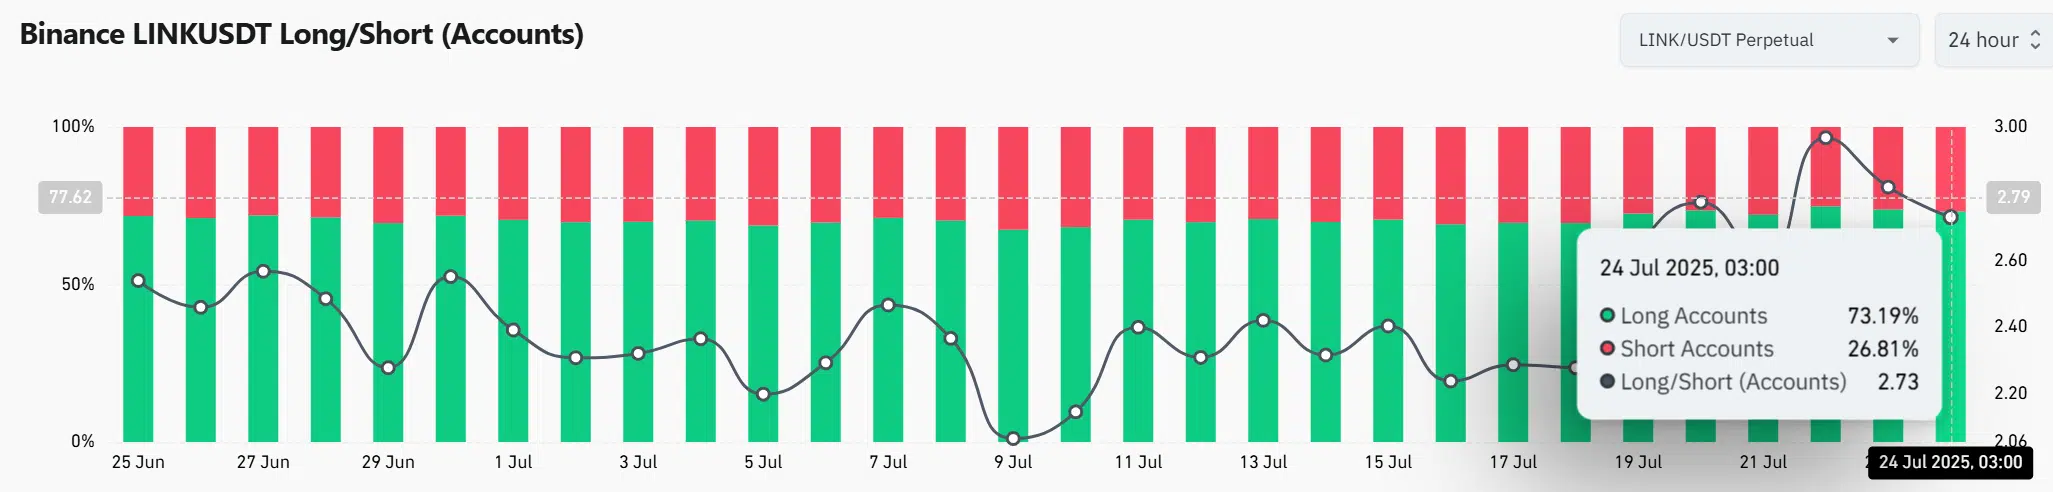
Despite the bullish Long/Short Ratio on Binance—where long accounts dominate at 73.19%—Open Interest (OI) has dropped by 15.11%, falling to $885.49 million, at the time of writing.
This divergence hints at leveraged traders closing positions, potentially due to short-term volatility or profit-taking.
While the long bias suggests optimism, falling Open Interest raises caution about market conviction. Therefore, traders should remain watchful, especially if this pattern persists.
If OI rebounds while long bias holds, it could signal renewed confidence to support a breakout.
Will accumulation and support hold fuel LINK’s next breakout?
The current metrics suggest that accumulation and support could fuel LINK’s next breakout.
Whale activity and large transactions confirm institutional confidence, while rising wallet growth shows retail engagement. If the $15.90–$17.39 support zone holds, momentum is likely to shift back toward bulls.
Although derivatives data shows mixed sentiment, the broader signals favor an upside move. A successful defense of support could ignite a rally toward $22 and potentially $26.


