
Despite an uptrend witnessed during the morning session and gains recorded by Bitcoin, the cryptocurrency market sustained heavy losses as most of the digital assets were painted in red towards the day’s end.
Chainlink was down by almost 4.5% at press time with the digital asset seen hovering just above its immediate support level.
The bearishness in Cosmos and VeChain however was even more prominent, with both recording a loss of over 6% over the last 24 hours, with some scope of bearish weakness for Cosmos visible on its chart.
Chainlink [LINK]
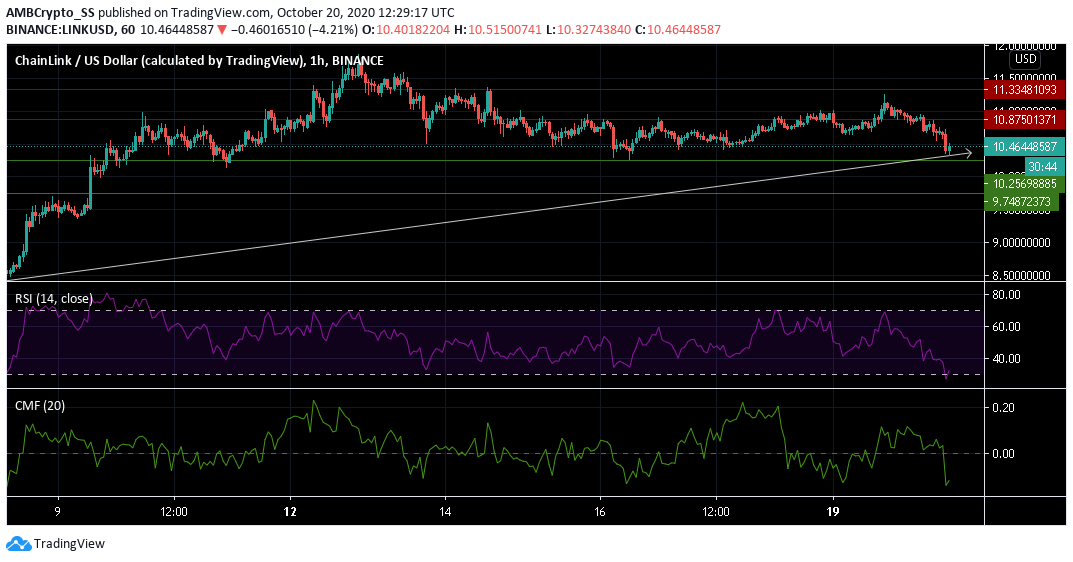
Source: LINK/USD on TradingView
Over the last 24-hours, Chainlink fell by 4.55% driving its price to $10.464. At the time of writing, the digital asset registered a market cap of $4 billion and ranked 7th according to messari.io.
The bearish scenario was also visible through its Chaikin Money Flow Indicator. CMF failed to retain its position above the zero-line and dived below it, indicating pressure on buy liquidities, as the capital quickly flowed out of the LINK market.
The Relative Strength Index too continued to tread well into the oversold territory, depicting extremely low buying pressure in the LINK market.
Given the strong selling pressures, a scenario of price stability above the $10.256 support level will be required to stall the bearishness over the next few days.
Cosmos [ATOM]
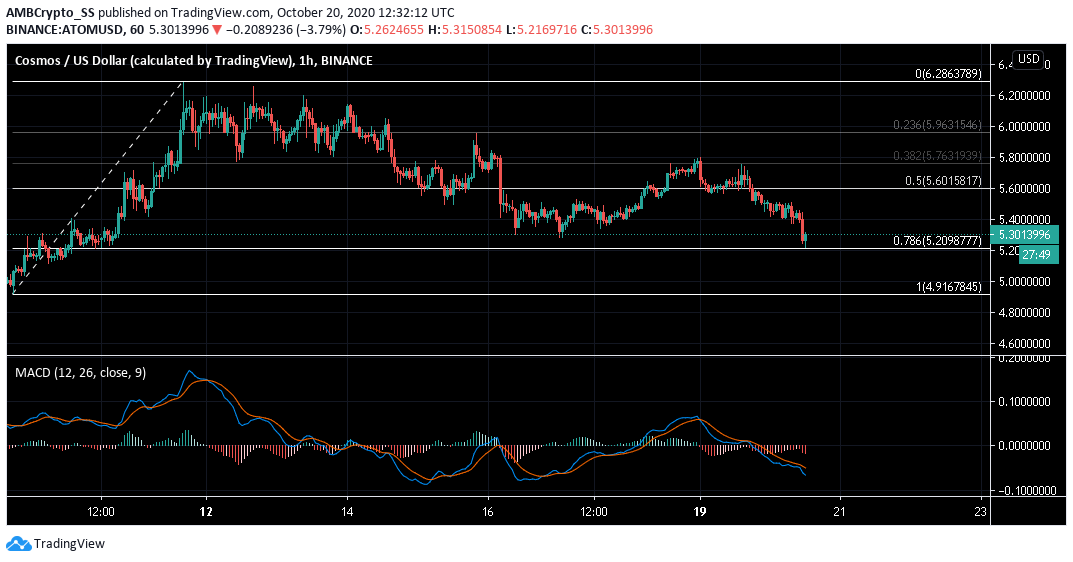
Source: ATOM/USD on TradingView
Bears appeared to have gained an upper hand in the Cosmos market as well, with the digital asset recording 6% in losses since yesterday.
The MACD histogram closing with red bars and both the MACD and signal lines below the zero line depicted the presence of strong negative momentum in Cosmos.
In fact, in a bearish move, prices had quickly dropped down to the 78.6% retracement region or the $5.2 support level marked by the Fibonacci retracement tool
If the bears gain strength and manage to breach below the 78.6% retracement level, it could push down the prices further, although a bounce above this level seems more likely.
VeChain [VET]
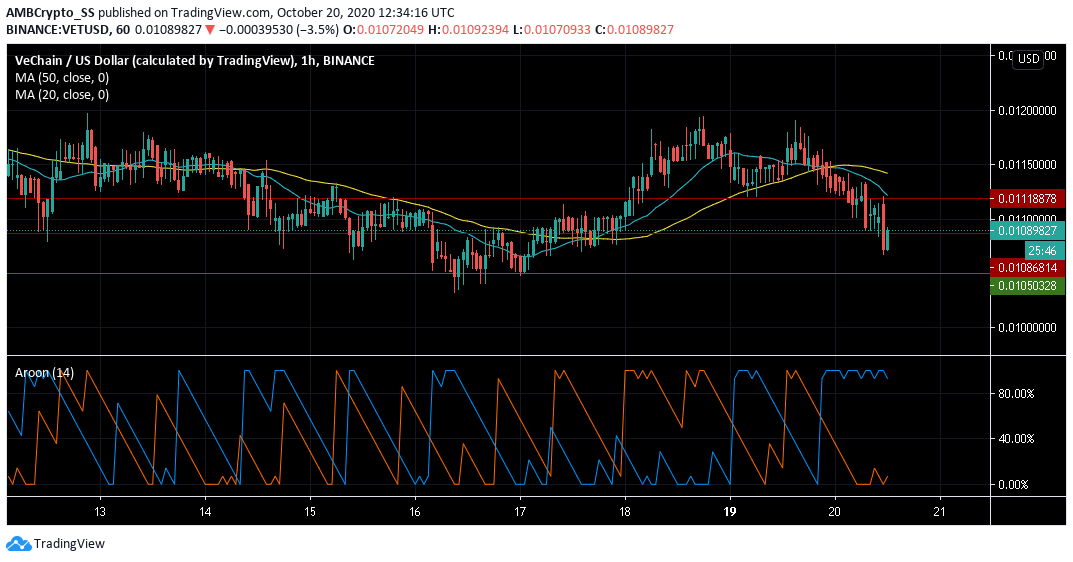
Source: VET/USD on TradingView
The VeChain market was down by almost 6% since yesterday, witnessing a drop below two of its resistance turned support levels.
The bearishness was further visible from its 20 and 50 period simple moving averages. The 20 SMA in a bearish crossover dived below the 50 SMA, with the bears further not respecting either of the short- or longer-term price trends.
Aroon indicator also clearly confirmed the extremely bearish scenario with the Aroon Up (orange) lying beneath the Aroon down (blue)
If the negative trend continues, VeChain bears could further target its immediate support level at $0.0105.