Altcoins
Cardano welcomes the bulls as it breaches descending channel pattern

Cardano rolled out the much anticipated Shelly testnet and in a recent event, Charles Hoskinson IOHK CEO revealed that an incentivized testnet would be launched by November of this year. Cardano’s native cryptocurrency ADA was seen falling by 21.73% in the last seven days. However, the coin witnessed a 1.19% increase in price over the past 24-hours. At the time of writing, the coin was valued at $0.038 and stood as the 12th largest coin by market cap.
1-Hour Price Chart

Source – Trading View
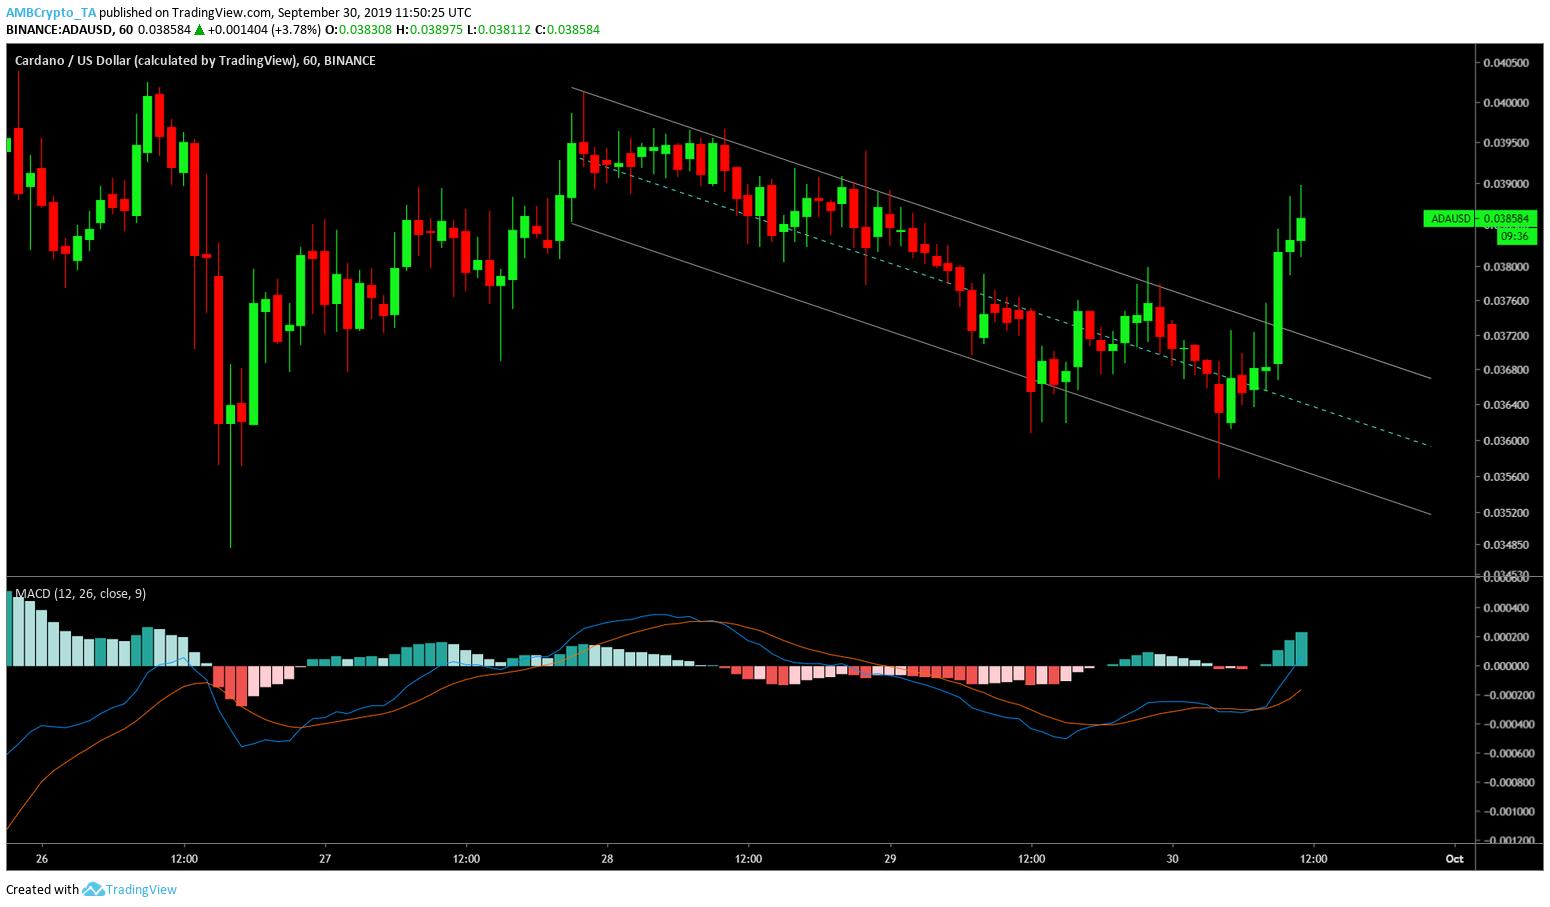
The one-hour chart for Cardano’s native currency, [ADA] revealed a descending channel pattern. This pattern was represented by lower highs which at $0.040, $0.039, $0.038 and $0.037. While the other trend line captured lower lows at $0.038, $0.036 and $0.035.
Furthermore, the pattern formed reveals a price breakout in the upward direction. MACD indicator highlighted presence of bulls in the ADA market due to formation of a bullish crossover.
Source – Trading View
As seen in the above chart the price of ADA has been below EMA Ribbon for a majority of the time however, recent breach of the price over the EMA Ribbon indicated that the narrative of the coin has flipped. 100 moving average stood as an affirmation to the same as the price of ADA was seen breaching it as well. Additionally, it can be incurred from the chart that ADA was heading towards a bull market as it is inches away from breaching the 200 moving average.
Conclusion
The short term chart for ADA revealed a descending channel pattern and the price of the coin is seen breaking out of the channel indicating a bullish market.

