
Ethereum soared to $466 and could target $500. Often, a bullish Ethereum can lead the rally for many altcoins, and that appeared to be the case once again, as Cardano looked to have reversed its downtrend with a strong surge above its immediate resistance. Synthetix confirmed a bullish pattern with a break-out to the upside, and eyed some lofty targets. DigiByte continued to bow under bearish pressure and looked set to lose support level it was trading at.
Cardano [ADA]
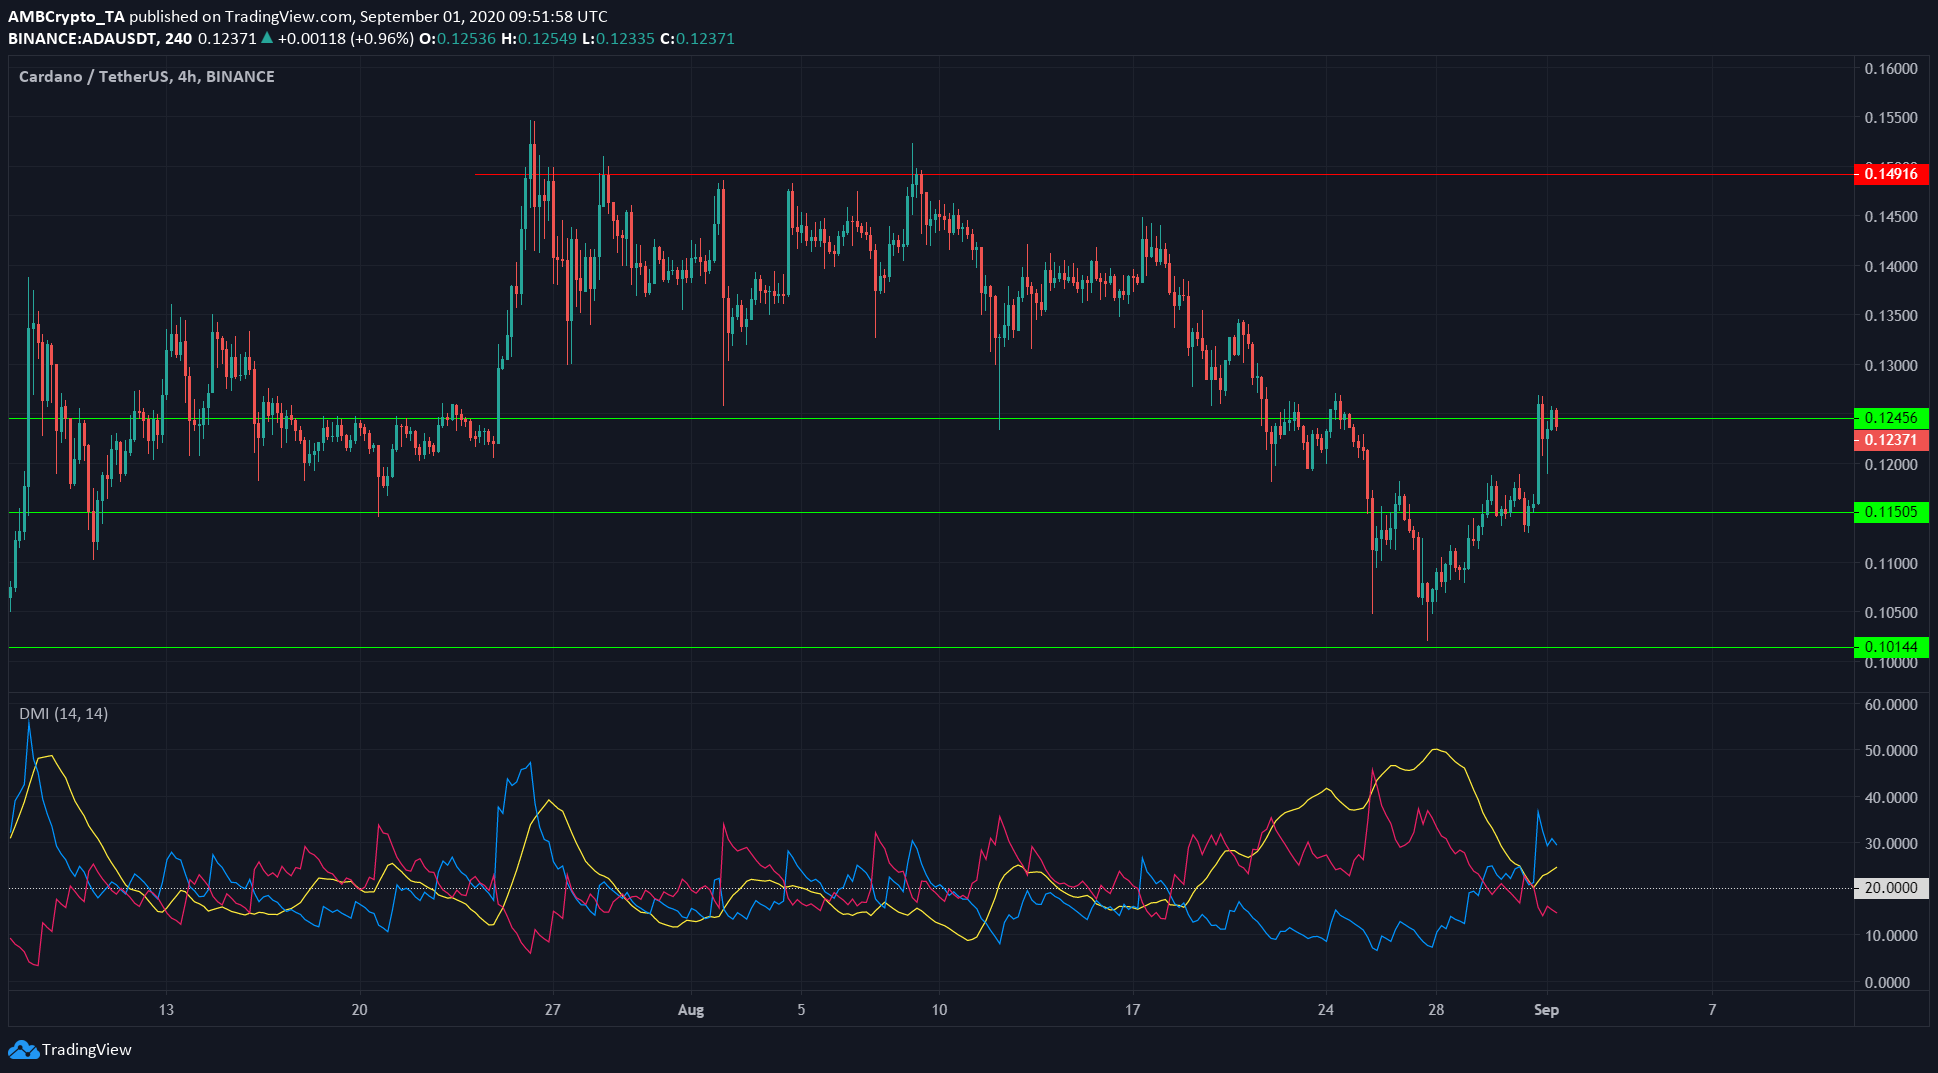
Source: ADA/USDT on TradingView
Cardano saw a strong surge upward after looking indecisive at the support level of $0.115. It was trading at $0.124 at press time, and at the resistance-turned-support level of $0.123.
Charles Hoskinson also appeared to be uncovering new horizons, as he admitted in an AMA that he has been “very obsessed with DeFi lately”, and that IOHK was researching into the DeFi ecosystem. In the short-term, this comment might not mean much for the price, but in the longer term, Cardano’s ecosystem could offer exciting opportunities in the DeFi sphere as well, leading to possibly greater adoption.
Synthetix [SNX]
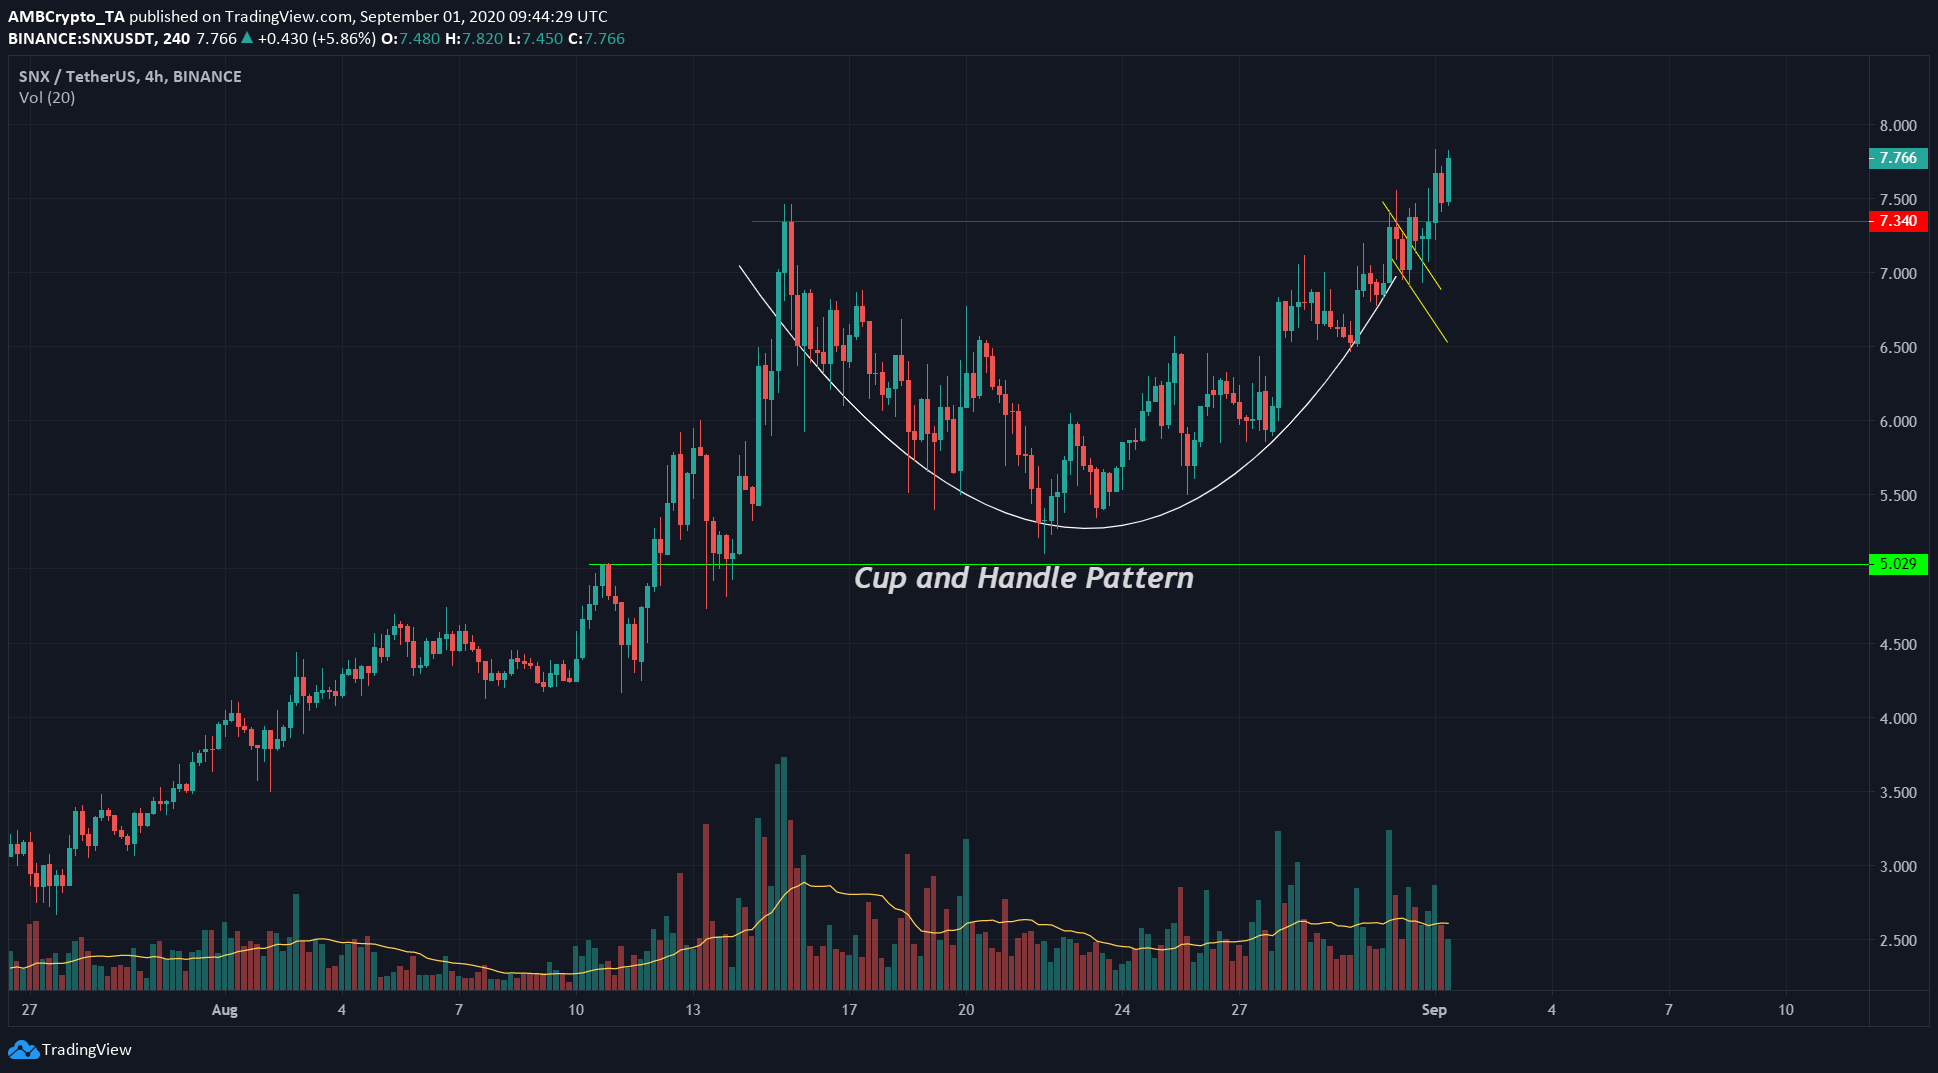
Source: SNX/USDT on TradingView
Synthetix looked to have confirmed the cup and handle pattern previously highlighted. The break-out above the tip of the pattern also happened on above-average volume, validating the move.
The upside target for SNX in the coming weeks is the depth of the cup, which means SNX can target $9.5.
DigiByte [DGB]
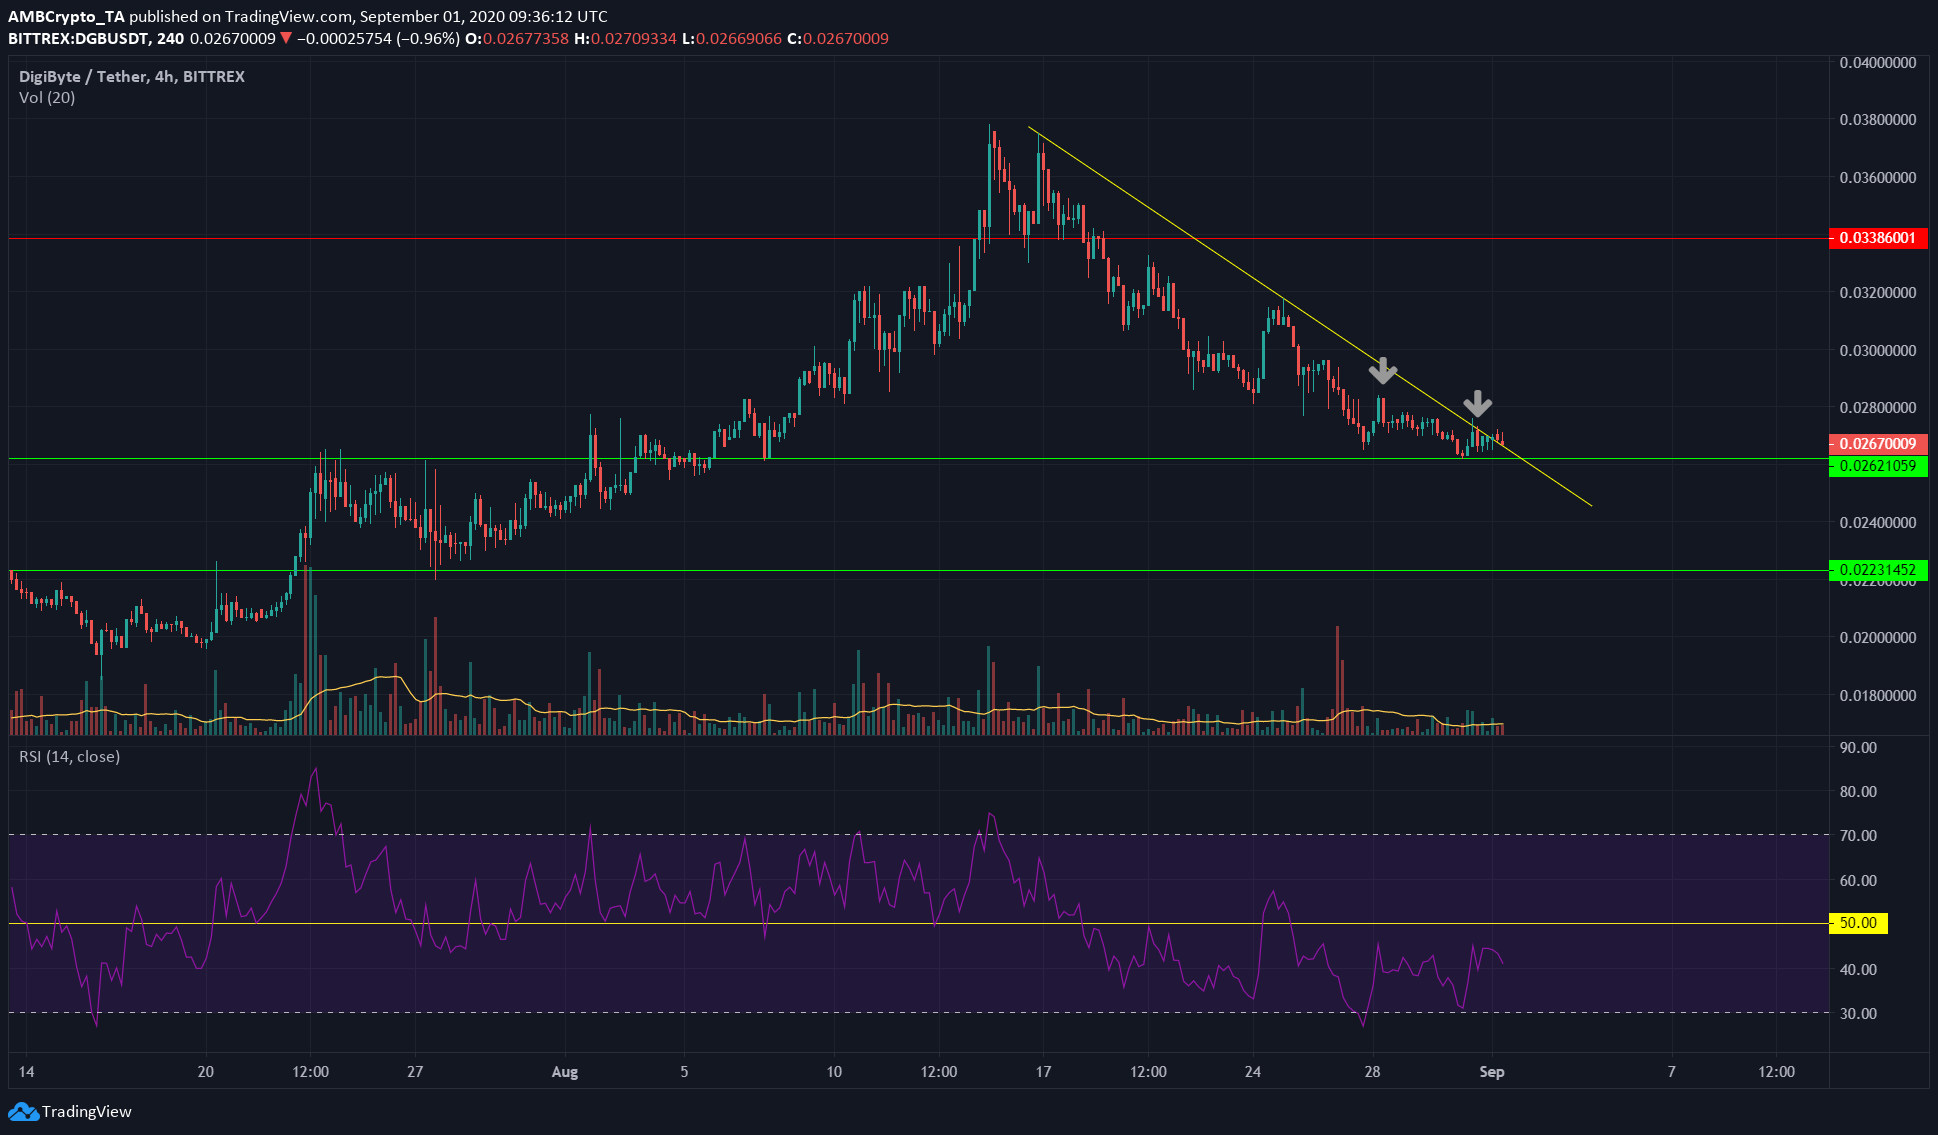
Source: DGB/USDT on TradingView
DigiByte showed bearish signals and it looked primed to lose the support level at $0.026 level.
The price has failed to break convincingly above the down trendline (yellow). The two grey arrows show bearish engulfing candles, with one of them being right next to the support level.
Sellers dominating so close to a support level indicated that DGB could drop to test next support at $0.022.
RSI was consistently below 50 for the past few days, showing bearishness. Even when RSI crossed into oversold zones, the buying pressure only lasted a few sessions before price slumped.