Analysis
Cardano short-term Price Analysis: 25 November

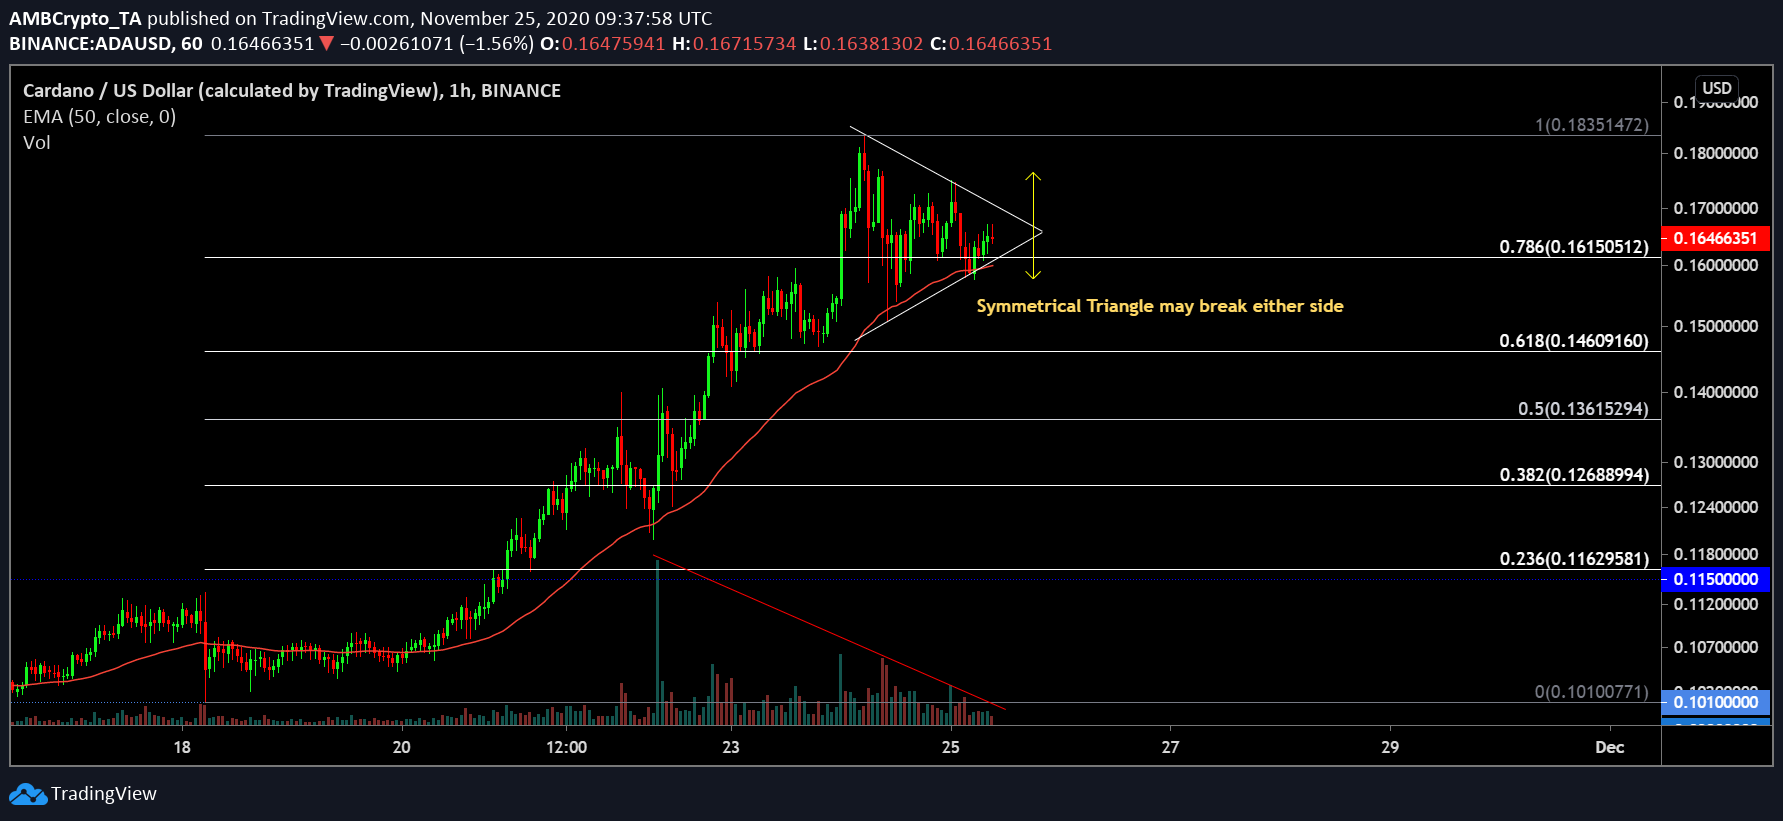
Cardano is currently manifesting its 2nd bullish leg for the year after its run in June 2020. Attaining a new $0.1835 yesterday, Cardano is currently on a minor decline on the short-term chart. While the collective market is still bullish, a little bit of neutrality is presenting itself on ADA’s market structure.
Cardano 1-hour chart

Source: ADA/USD on Trading View
After consolidating under $0.11 for the past few weeks, ADA’s market-rise in the month of November has been extremely explosive. However, after reaching $0.1835 yesterday, its price action has formed a symmetrical triangle. Such a pattern undergoes a breakout but the chances are evenly-split on both bullish and bearish trends.
With respect to 50-Moving Average, the indicator is currently acting as an underlying resistance. However, the price hike has been a couple with falling declining volumes, which is a major bearish divergence.
Market Reasoning
Source: ADA/USD on Trading View
The neutral trend was identified with other indicators as well. Stochastic RSI is rising in terms of bullish momentum, but it is still open for a radical shift. Relative Strength Index or RSI is currently at a level that is neutral between both the buyer and sellers. However, Awesome Oscillator indicated a clear rise in bearish momentum.
Important Range:
Resistance: $0.1835, $0.1700
Support: $0.161, $0.146
Risk Factor high to call a long or short position
Verdict:
Calling a direction over the next few hours is a little difficult since there is a contradiction in market indicators. With Cardano, the price might drop a little just because it has risen quite a bit over the past few days. However, if the bullish momentum collectively kicks in again, a re-test from $0.161 will push the asset towards $0.1835 once more.

