Analysis
Cardano short-term price analysis: 16 September

Cardano has dropped out of its bearish pattern, however, its journey higher starts now. With rising bitcoin prices and dominance, there might an altcoin sell-off soon, which might hamper altcoins’ performance.
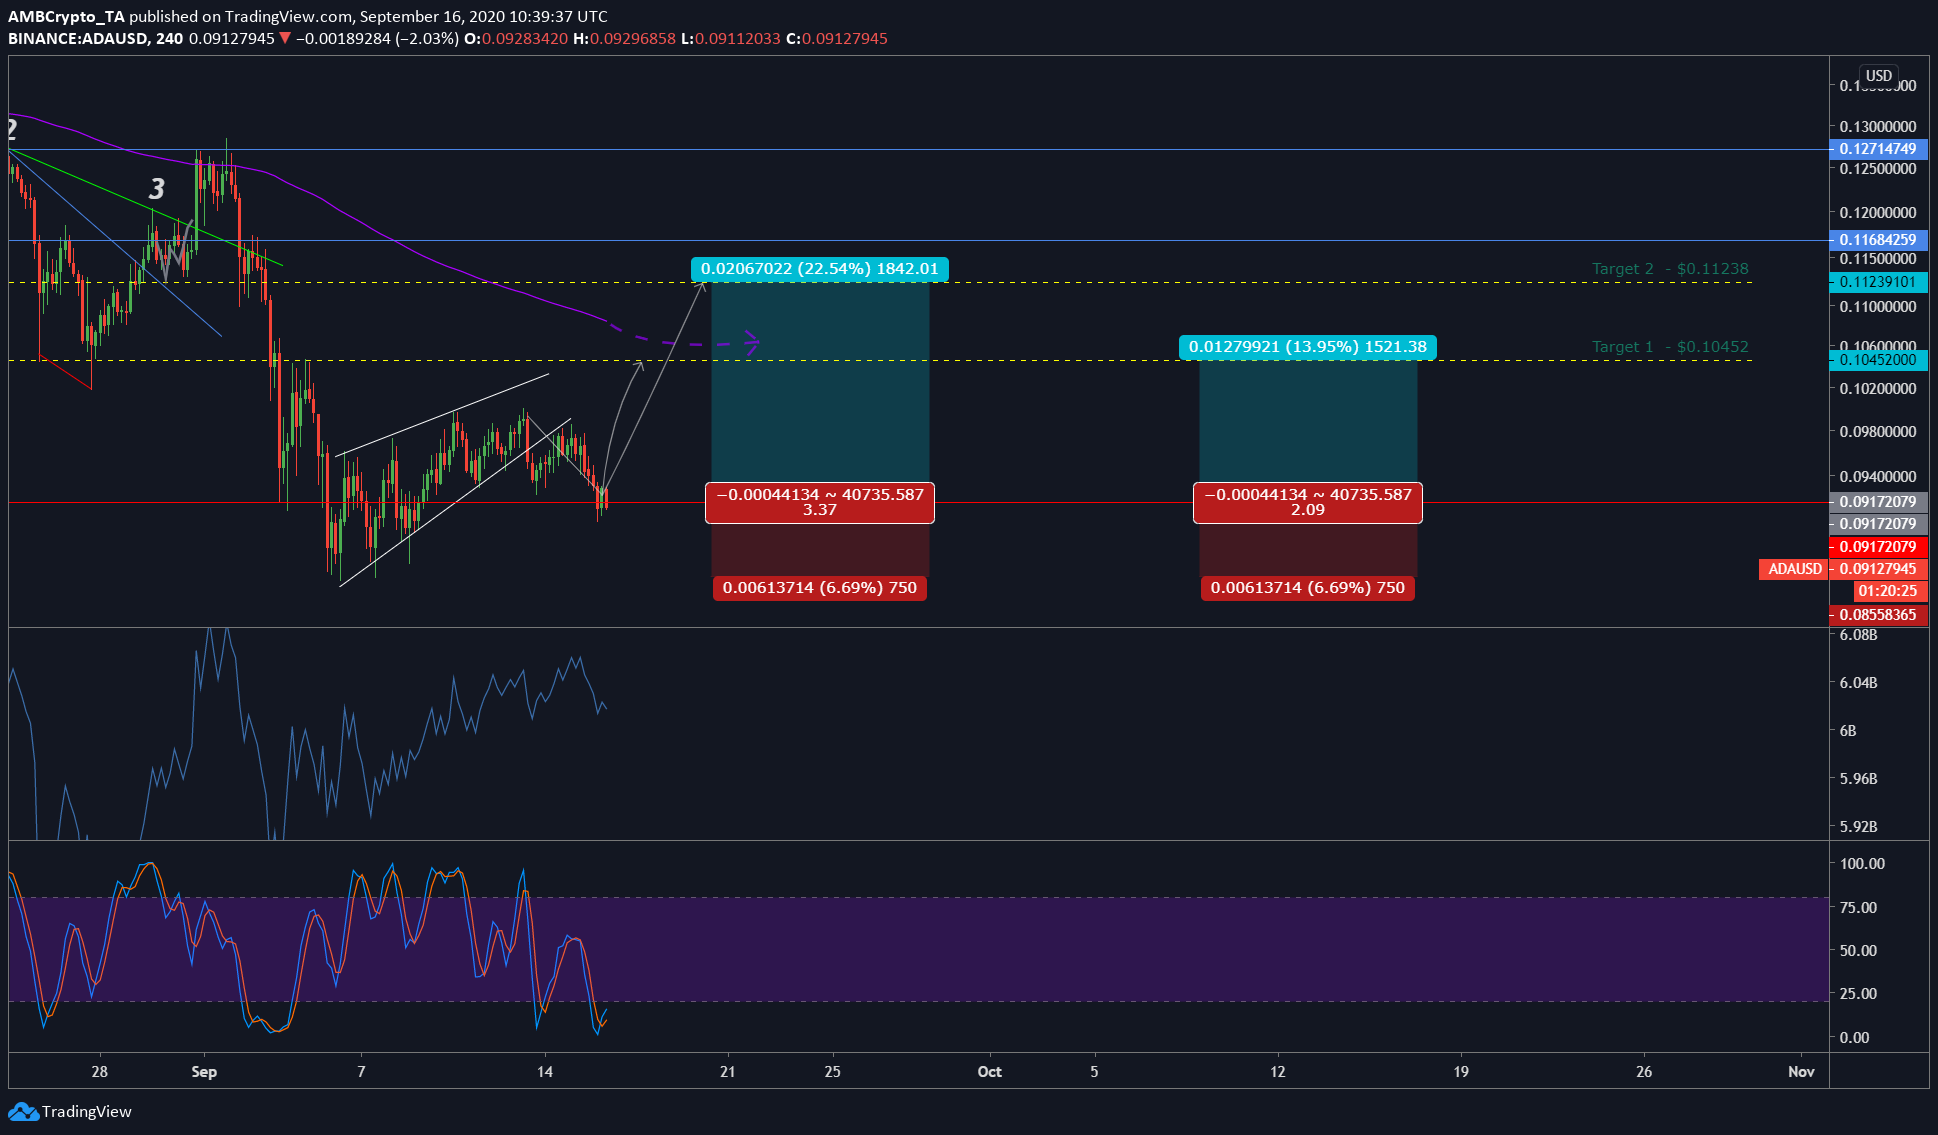
Cardano 4-hour chart

Source: ADAUSD TradingView
The chart shows the price of Cardano breaking promptly from the rising wedge. After testing the support at $0.09172079, an impulse wave can be expected from ADA. This is the rationale behind the long-position that will be taken for ADA.
There are two targets for the current long position, the first at $0.10452, which would mean a price surge of 14%; the second target is at $0.1128 or a 22.54% surge.
Opening a long position at the aforementioned support [$0.0917] with stop loss at $0.08558 would yield an R of 2.09. With the same entry and stop-loss, but with target 2, the R would be 3.37.
Either way, a long position is the best bet considering the uncertain situations. Adding more support to this long position is the OBV indicator which has formed a higher low while the price has formed a lower low, which is a clear bullish divergence.
Additionally, the Stochastic RSI is in the oversold zone is a bullish crossover waiting to exit the oversold zone.
Altcoin Dilemma
Furthermore, the altcoin dominance is on the drop in the last 2 months while bitcoin’s dominance is rising. A crossover would spell disaster for altcoins, including Cardano. A lot of low cap altcoins suffered a drop in the price yesterday and it might be time for high cap altcoins to spill some blood as well.
Hence, care should be taken with trailing stop-loss or any other method if one longs altcoins.

