Altcoins
Cardano may exhibit positive break following descending channel formation

Cardano has been severely affected in the process after the altcoin registered its yearly-low of $0.0347. At press time, Cardano was valued at $0.0392 with a minor growth of 0.98 percent over the past 24 hours.
1-Day Chart

Source: ADA/USD at Trading View
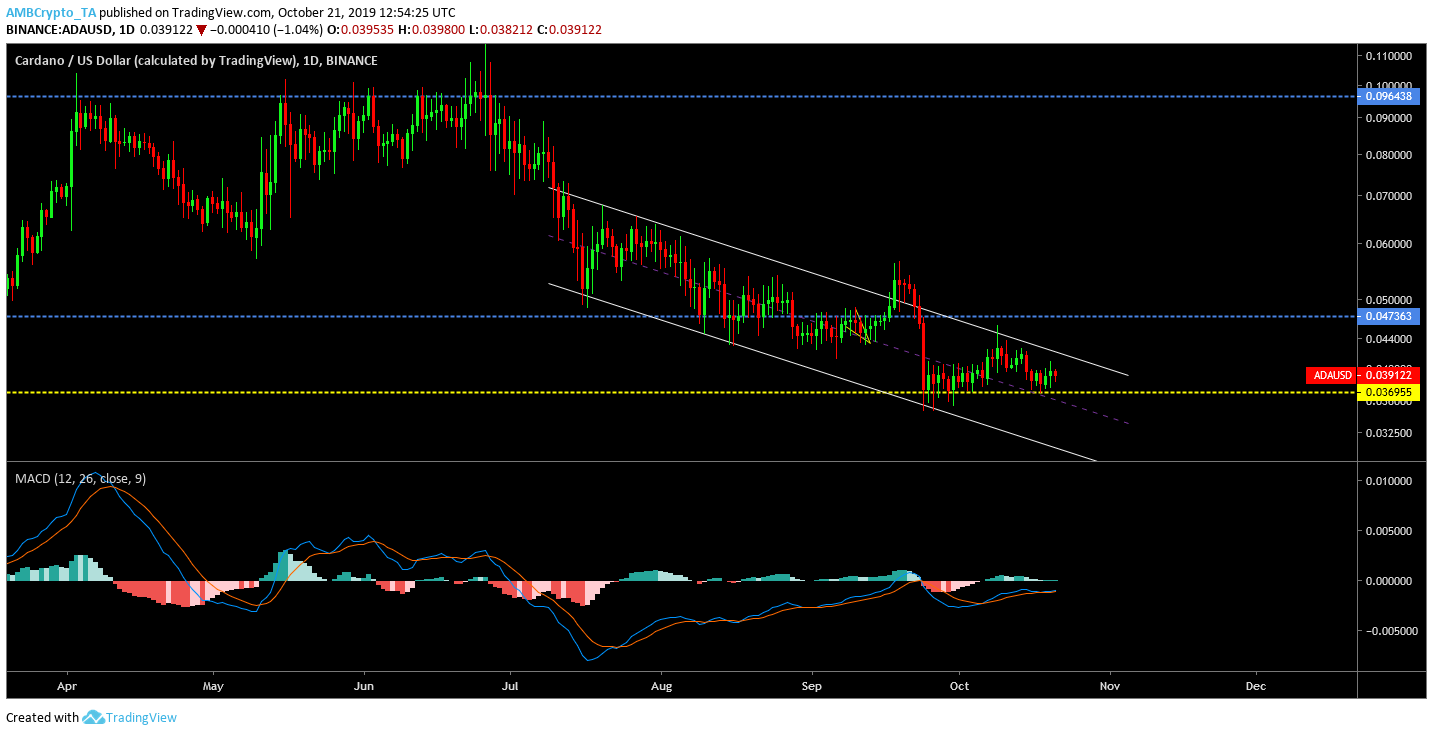
Cardano’s 1-day chart indicated a clear depreciation over the past few months and also exhibited a descending channel. The descending channel has been taking shape since 12th July and the price movement of ADA has been within trend lines. The pattern formation indicated that a bullish breakout should surface for ADA over the next few days.
However, it was important to take note that a bullish breakout did occur on 22nd September, but the breakout turned bearish within 48-hours, which eventually led to the fall on 24th September.
The MACD line indicated a bullish period at the moment but stayed close to the signal line.
12-hour Chart
Source: ADA/USD at Trading View
The 12-hour chart had an identical pattern in comparison to the 1-day analysis, as a similar descending channel was observed. The trading volume had decreased as well, which confirmed the validity of the channel. A bullish breakout should see price re-test the resistance at $0.0473 but the long term resistance at $0.0622 would be difficult to breach.
The Relative Strength Index for Cardano indicated a neutral stance at the moment but an increase in buying pressure should further improve the possibility of a bullish breakout.
Conclusion
A bullish breakout was on the cards for Cardano as the decline has been evident over the past 4 months. However, the market momentum was pretty low and a significant bullish break may not surface anytime soon for the altcoin.
