Analysis
Cardano, Cosmos, BAT Price Analysis: 11 November

Cardano rose past a region of supply and could be headed further upward to resistance. Cosmos retraced some of its gains from the previous month and was headed higher, but could see a drop in the coming hours while Basic Attention Token was in a long-term downtrend, and the bears were likely to impose themselves on the market once more.
Cardano [ADA]

Source: ADA/USDT on TradingView
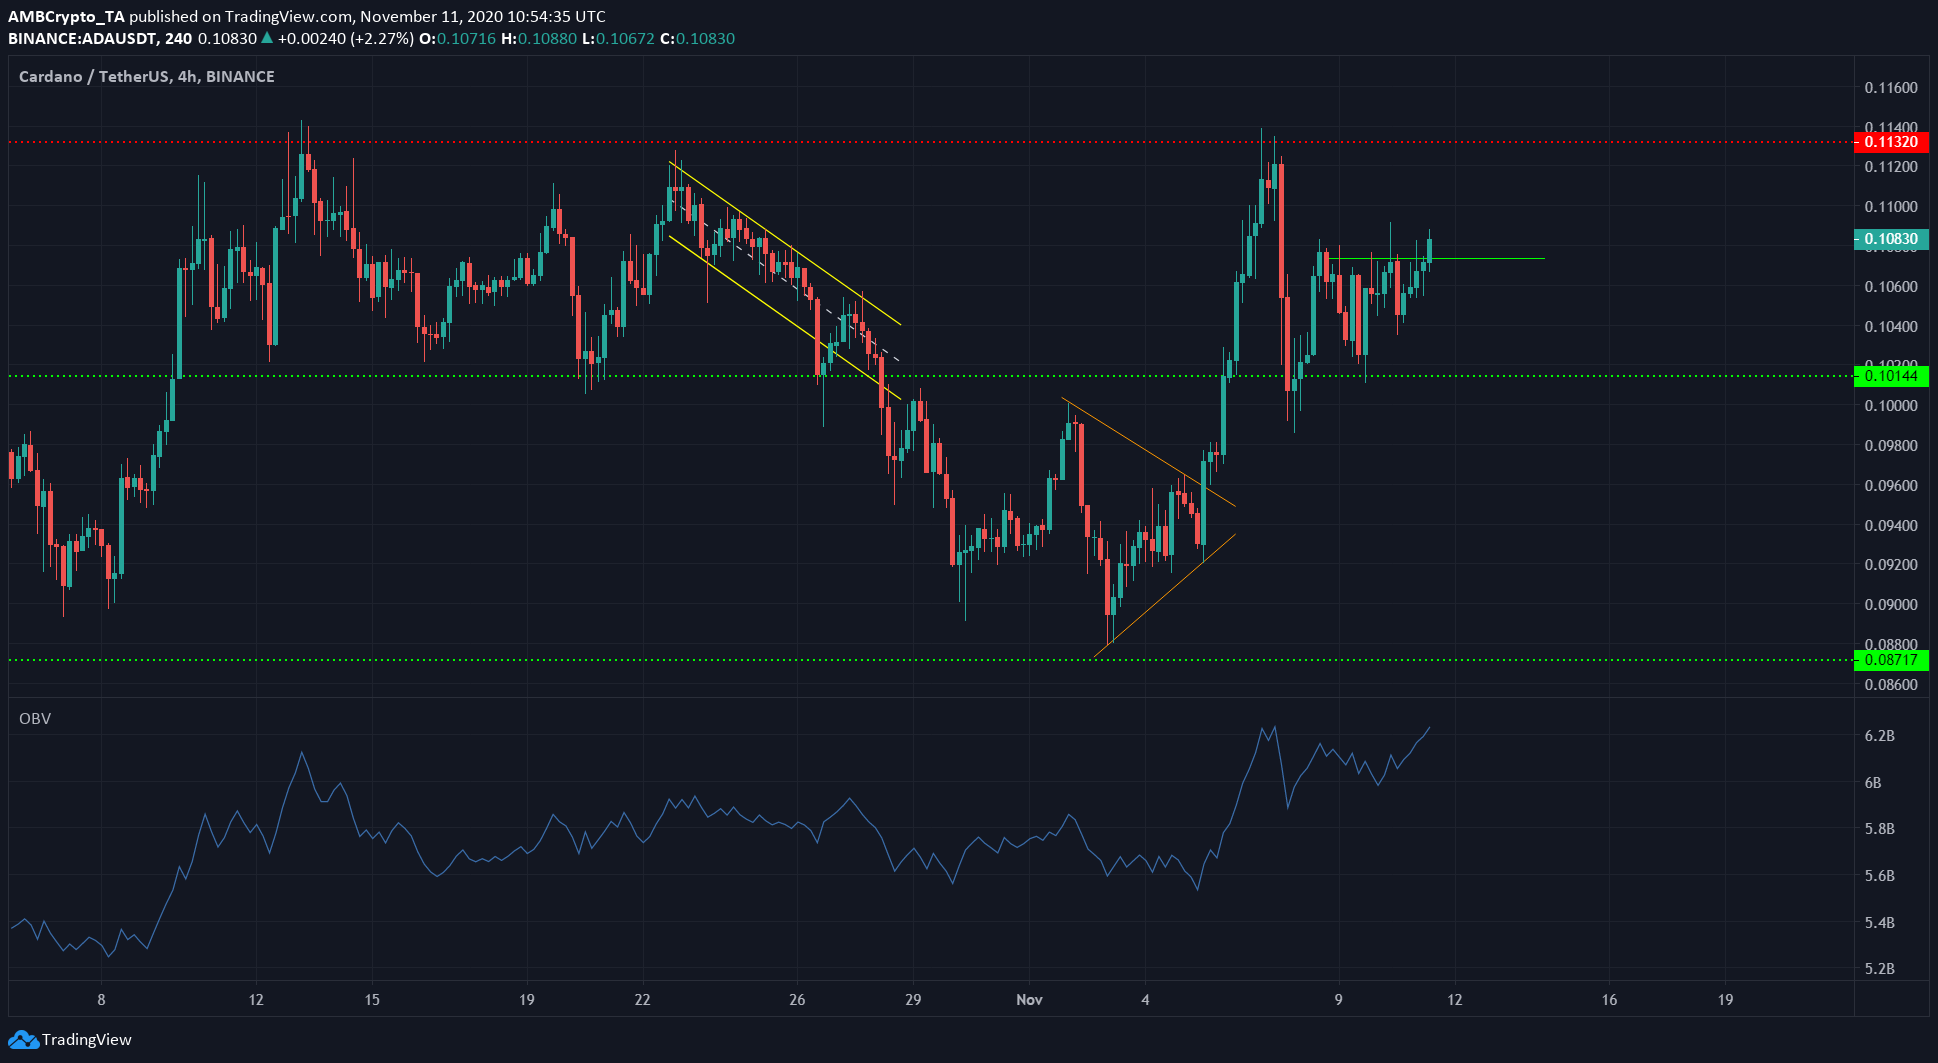
Cardano moved above the level at $0.107 which has served as resistance in the past few days. The OBV also showed a spike in buying volume in the past few days.
Taken together, ADA was likely to rise further, with the next level of resistance at $0.113.
Cosmos [ATOM]

Source: ATOM/USD on TradingView
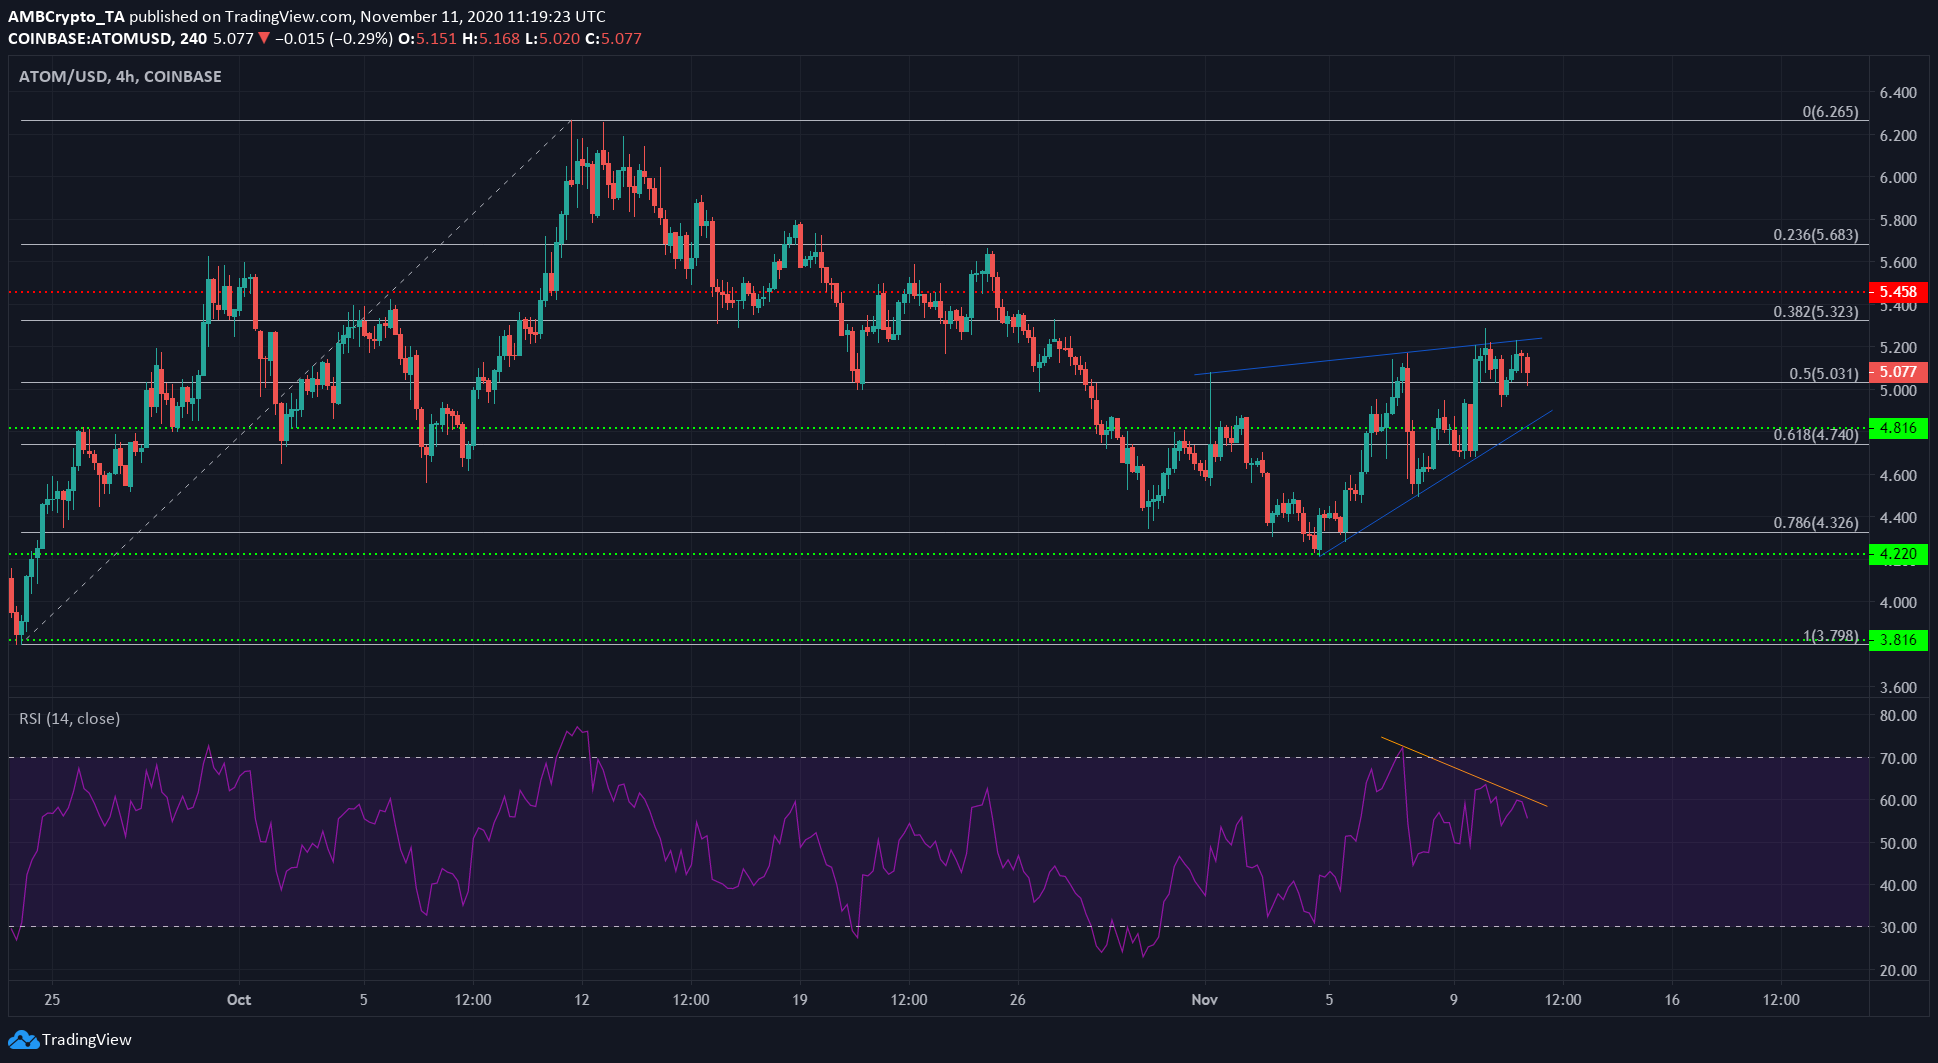
ATOM was in an upward rally and moved past level after level of resistance. The Fibonacci Retracement tool for the move from $3.8 to $6.26 highlighted some important levels.
The coin rose from $3.95 to $6.26, then retraced to 78.6%, and appeared to be moving back upward. In the past few days, a rising wedge (blue) was forming.
There was also a bearish divergence (orange) between price and momentum (RSI), which saw a drop from $5.18 to $4.96.
Considering that ATOM was recovering after retrace, an impending drop for ATOM might be a pullback rather than another move toward the lows of the past two months.
Hence, a drop for ATOM to the level of support at $4.8 was possible in the coming days.
Basic Attention Token [BAT]
Source: BAT/USD on TradingView
The longer-term trend for BAT has been a downtrend. It has been forming a series of lower highs since late August, after its surge to $0.42.
BAT has been making higher lows in recent days in what was likely a bounce upward for the coin, before another move down. A level of support lies at $0.2 for the Brave browser’s reward token.
The price was moving above its 20, 50, and 100-period moving averages (white, yellow, and pink respectively). While the 20 SMA moved above the 50 SMA to indicate recent bullishness, the 100 SMA was still moving to the downside, showing the longer-term bearish pressure.

