
- Ethereum’s social activity has risen in the past 24 hours.
- However, bearish sentiments continue to climb.
Leading altcoin Ethereum [ETH] has seen a spike in social activity following reports from multiple issuers in Hong Kong that their applications for spot bitcoin and ether exchange-traded funds (ETFs) have been approved, according to Santiment.
?️ As #crypto prices have been on the decline, #Ethereum is seeing the fastest rise in discussion rate. The new #ETF has caused more interest in the #2 market cap asset, even though #shorts are rising rapidly. Also, keep an eye on #Beam's rise in interest. https://t.co/0bfF7HR4lw pic.twitter.com/j6zyJqpiMT
— Santiment (@santimentfeed) April 16, 2024
On 15th April, in a series of announcements, China Asset Management, Harvest Global Investments, Bosera Capital, and other applicants confirmed that the Hong Kong Securities and Futures Commission (SFC) had approved them to list spot BTC and ETH ETFs in the region.
This resulted in a rally in ETH’s discussion rate on social media platforms.
ETH reacts but negatively
Despite the spike in ETH’s social activity, its price has failed to see any significant price reaction. Exchanging hands at $3,086 at press time, the altcoin’s value has declined by 5% in the past 24 hours, per CoinMarketCap’s data.
On-chain data provider Santiment also noted that the period under review has been marked by a spike in ETH shorts positioned open. According to its post on X, this had grown by 54%, signaling the rise in bearish sentiment.
Although ETH rose briefly to trade above $3,200 after the announcement of the series of ETF approvals granted by the Hong Kong regulator, bearish sentiments quickly overshadowed these gains.
Key indicators assessed on a 1-day chart revealed the possibility of a further price dip in the short term. For example, the dots that make up the coin’s Parabolic Stop and Reverse (SAR) indicator rested above its price at press time.
The Parabolic SAR indicator is used to identify potential trend direction and reversals. When its dotted lines lie above an asset’s price, the market is deemed to be in a downtrend.
Many traders interpret this as the time to exit long positions or initiate short positions.
Further, readings from the coin’s Moving Average Convergence Divergence (MACD) indicator confirmed the growth in bearish sentiments in ETH’s market.
Read Ethereum’s [ETH] Price Prediction 2024-25
At press time, the coin’s MACD line rested under its signal line and below the zero line.
When an asset’s MACD line crosses below its signal line, the short-term moving average is below the longer-term moving average. Traders interpret this to mean that the downward momentum is stronger in the short term.
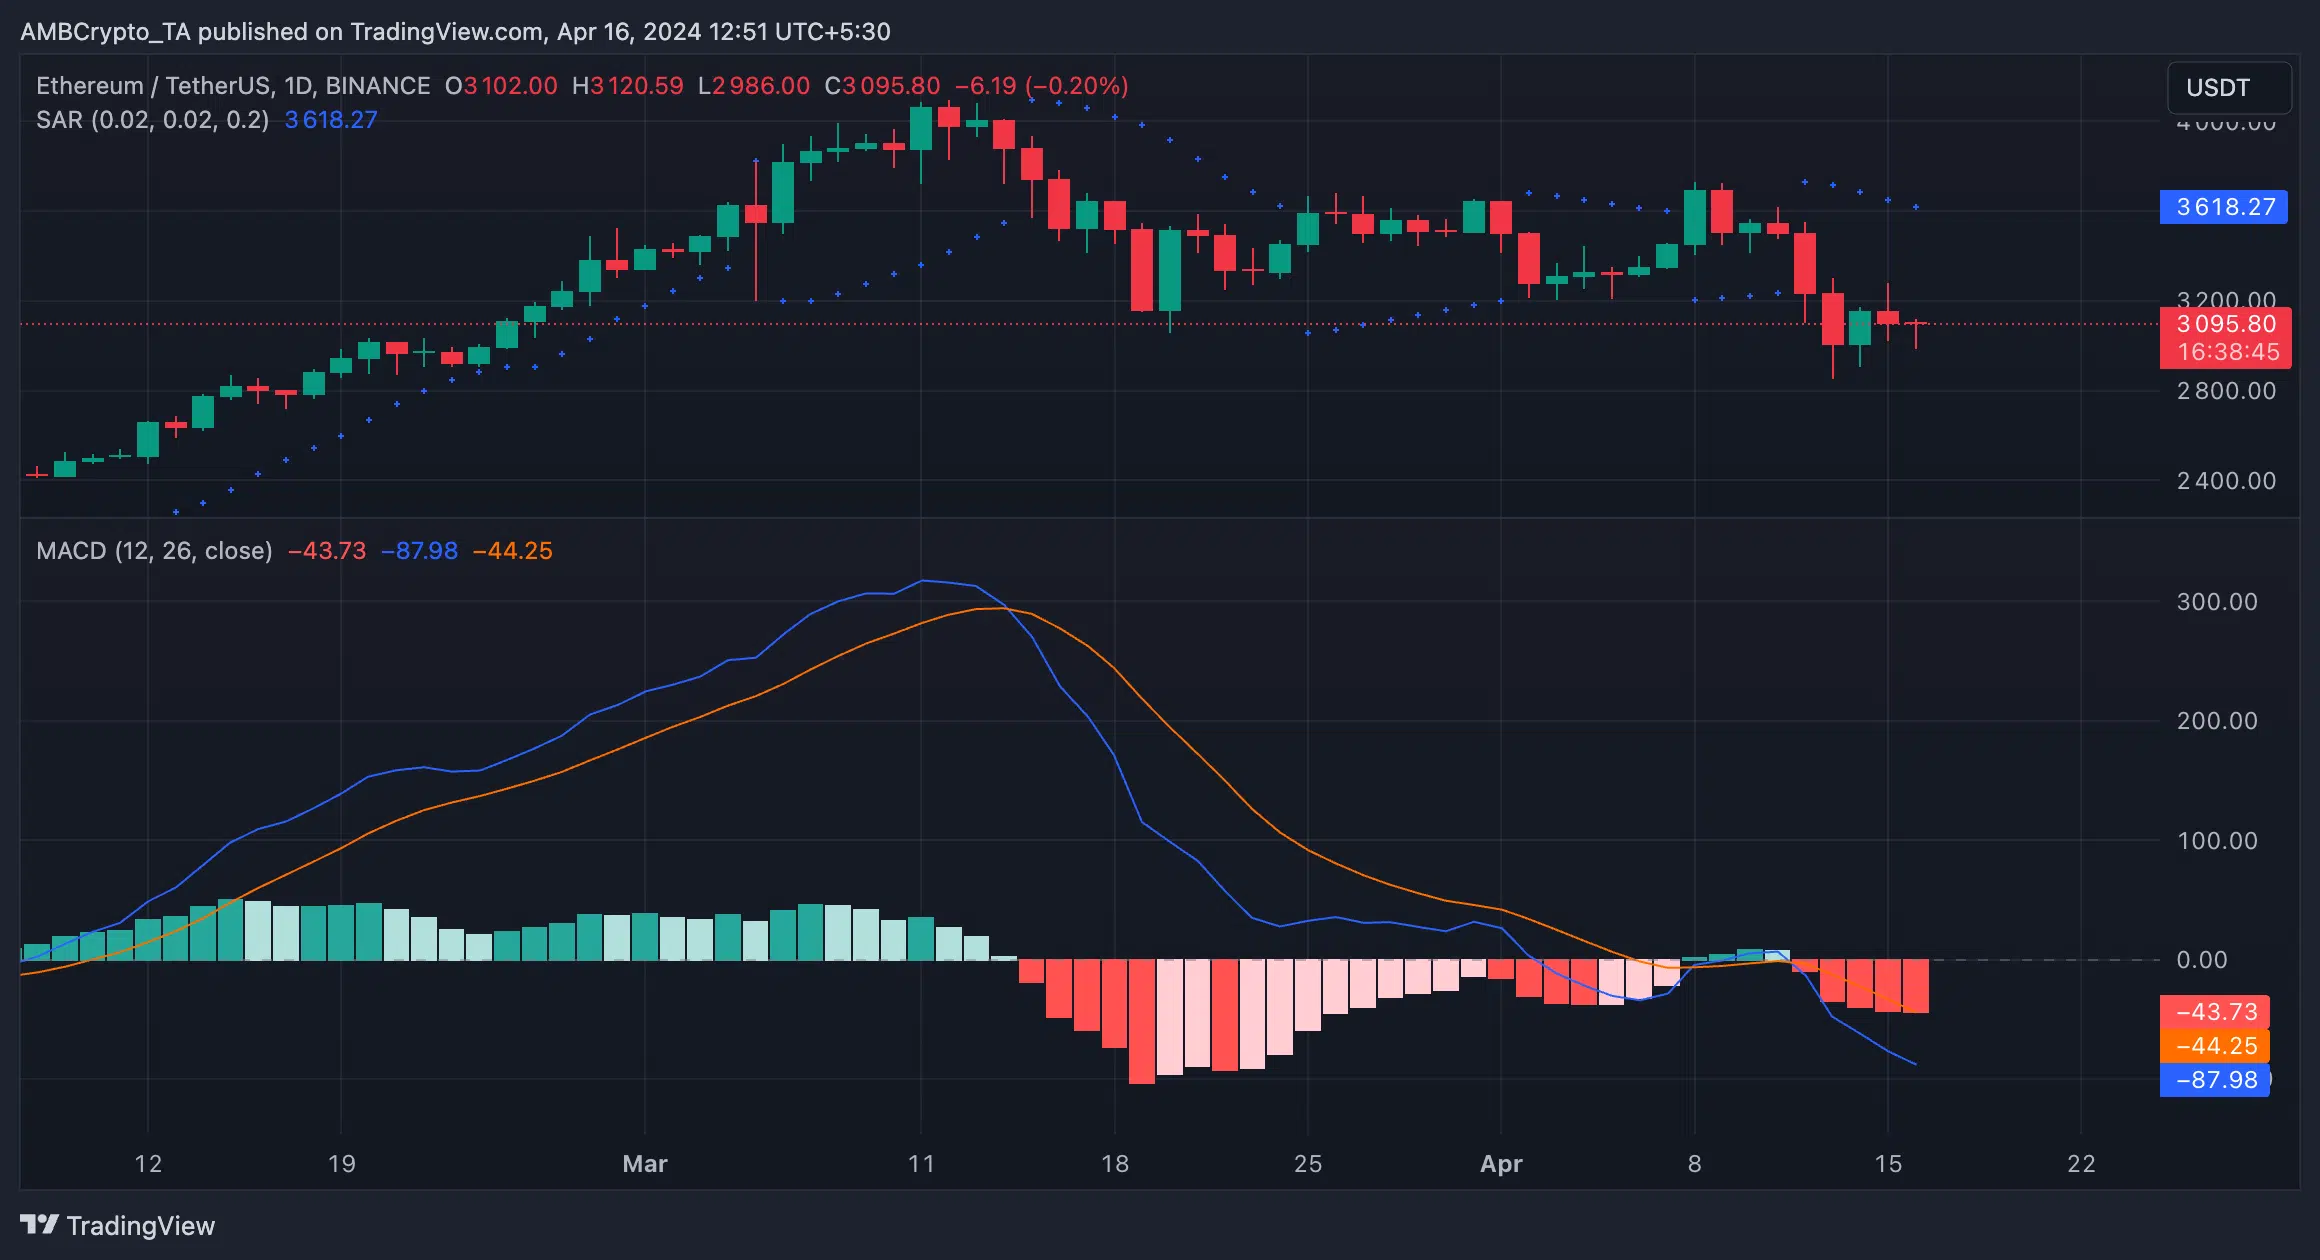
Source: ETH/USDT on TradingView


![Arbitrum [ARB] - 50% hike after ETH's rally, but can it hold on for token unlock?](https://engamb.b-cdn.net/wp-content/uploads/2025/08/Ritika8-400x240.webp)
