Crypto News
Can Bitcoin’s history with hodling help the bulls?

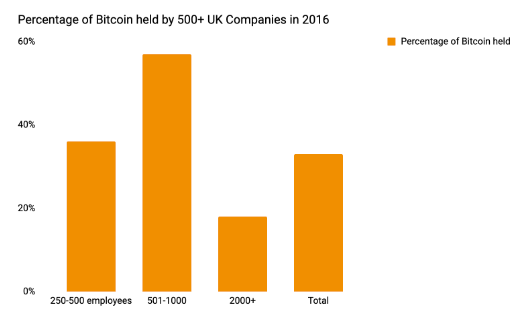
Hodling as a strategy to drive up prices is still as relevant as 2016 and early 2017. A third of UK companies had stockpiled Bitcoin in 2016, well ahead of the anticipated bull run. Their reason was protection against hacking and ransomware attacks, however, the risk is higher with Bitcoin’s involvement. This Hodling incident was one of the firsts, close to the bull run.

Source: Citrix
Starting in 2017, Hodlers booked profits and the number of Bitcoin held in idle wallets dropped as the price increased.

Source: lookintobitcoin
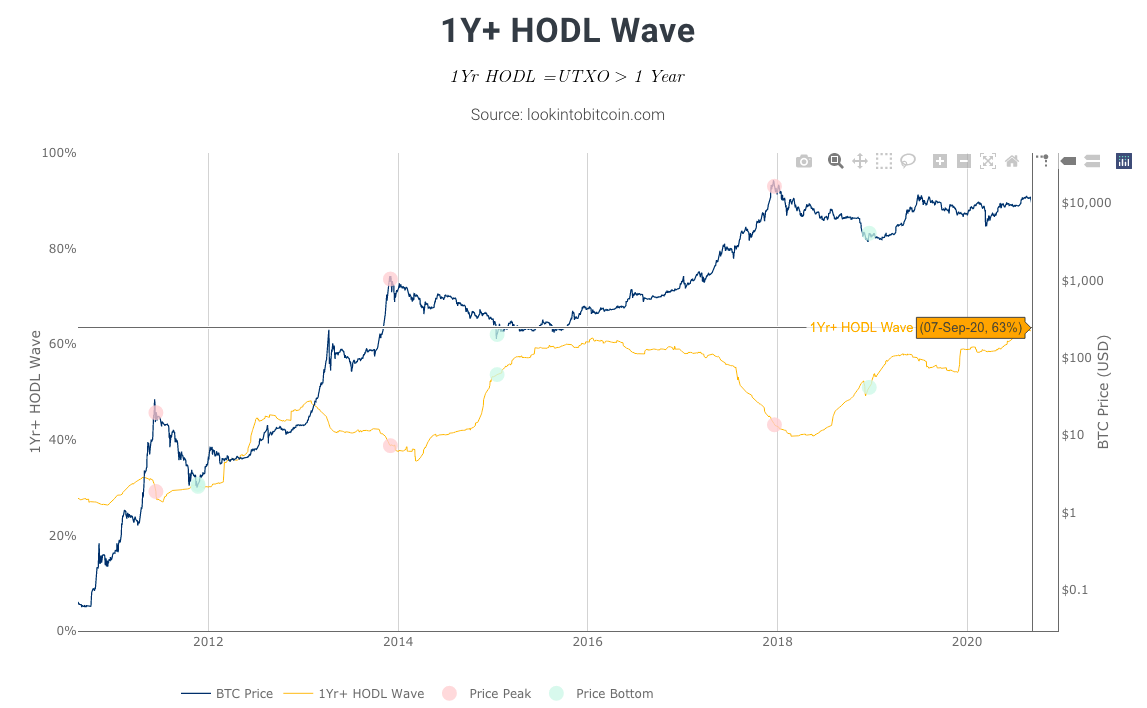
A similar pattern has emerged, and it started in the second half of 2018. Starting at 40%, the percentage of hodlers holding Bitcoin since 52+ weeks has climbed up to 63%. This cycle may repeat again and continue until the end of 2020 when Bitcoin price hit’s a new peak (higher than the previous one) as per the trend.
In the 1Y+ HODL Wave, we can see the proportion of 1yr+ coins decreases as the price climbs up towards a new cycle high. In the previous market cycle, when hodlers who held onto their Bitcoin for over 1 year decided to cash in some profit, they sold their holdings and this Bitcoin no longer qualified as 1Y+ in the analysis. This is why the 1Y+ HODL line on the chart dropped and the Bitcoin price went up consecutively.
The previous hodl cycle rapidly pushed the price up, and the surrounding hype. The price plummeted at a similar pace.
Source: Glassnode
However, this market cycle hodlers are taking it slow and steady and building momentum, setting the stage for a prolonged boost in Bitcoin’s price in early 2021.
Source: Chainalysis
Bitcoin held for 52+ weeks experienced the largest one week increase in 81 weeks and increased by 108.41k BTC. This took the total USD value of BTC held for 52+ weeks to 10.64 M.
Hodling is affecting Bitcoin Exchange Reserves across spot exchanges globally, as per Cryptoquant’s chart, the current HODLing has dropped Bitcoin reserves to $2.4 M level. This is in line with the 1Y+ chart and the trend followed in 2016-17.
Source: Cryptoquant
The Bitcoin bull’s best friends continue to HODL, as we enter the next phase of the market cycle and prepare to book profits.
