Can a reset in Bitcoin’s Fear and Greed Index mark a new cycle phase?

- The Bitcoin Fear and Greed Index showed a healthy reset recently.
- The price action was firmly bullish, although a deeper retracement can’t be fully discounted.
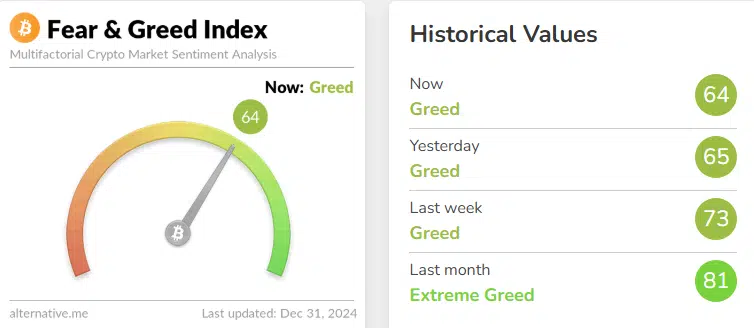
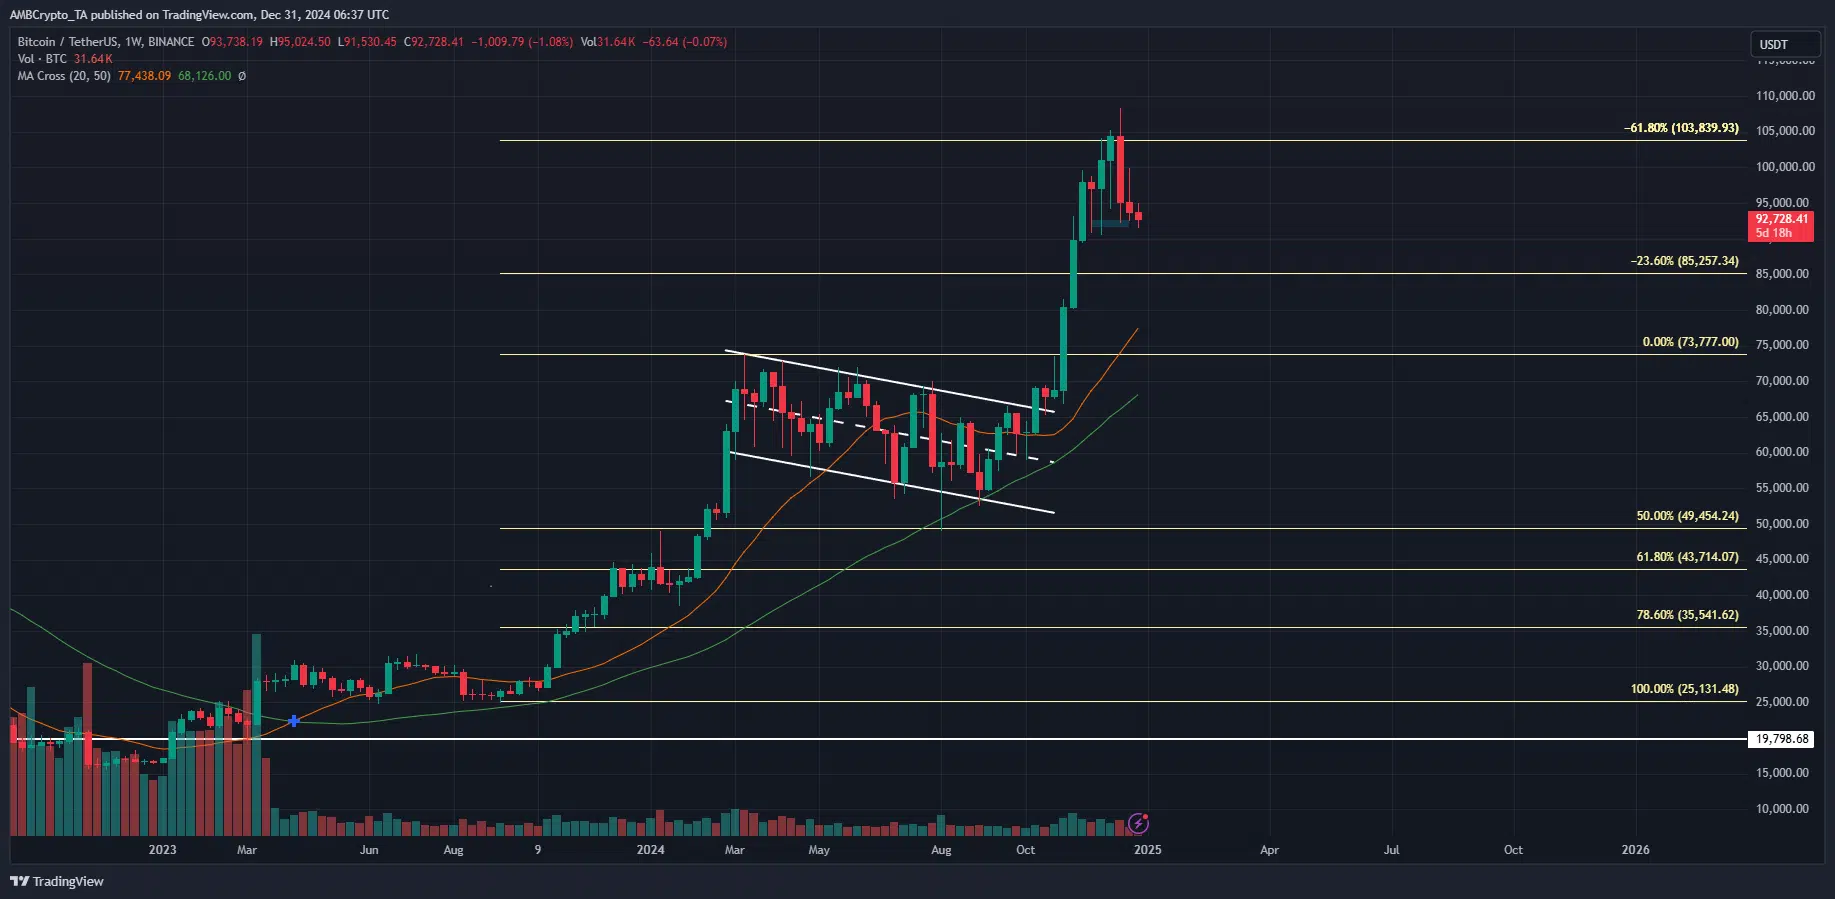
Bitcoin [BTC] was trading at $92.8k, at press time. This was a short-term demand zone, a bullish order block formed on the 26th of November. Despite the tepid price action in recent weeks, the market sentiment remained greedy.
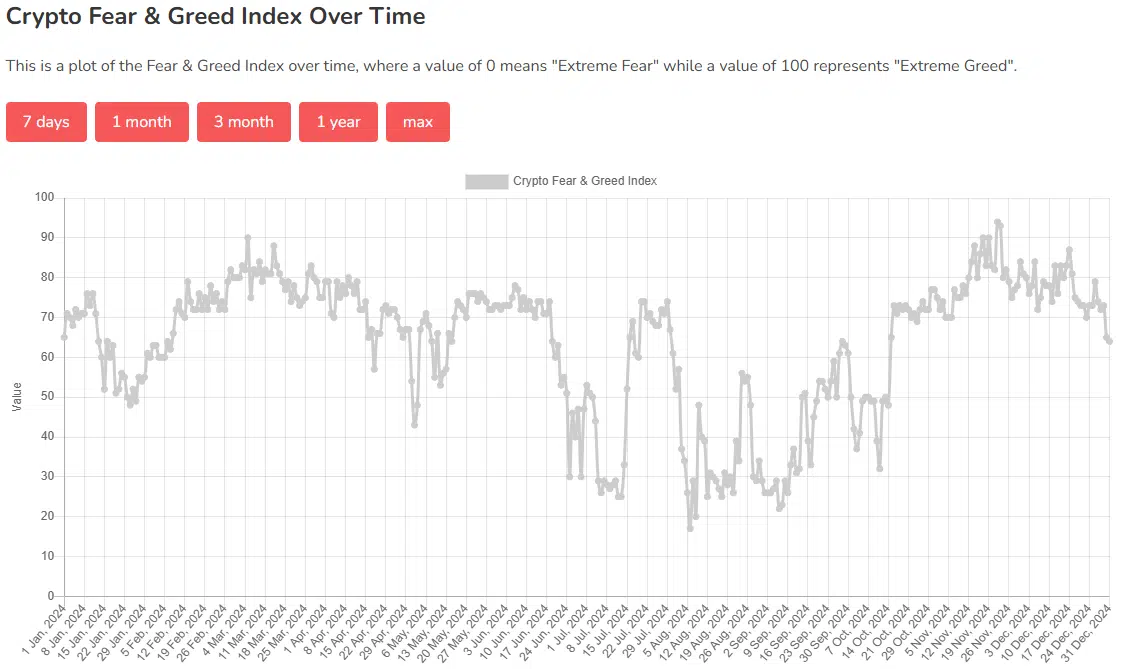
The reading of 64 reflects a drop from the 75+ values observed in the second half of November when the uptrend accelerated. The correction over the past two weeks has hurt sentiment but also provided a much-needed reset.
The Bitcoin Fear and Greed readings over time showed that the recent rejection from $100k has reset greed to 64. This value was lower than any that was seen since the 15th of October. Yet, the price of Bitcoin is up by 40.57% since then.
Bitcoin Fear and Greed from the price charts
The price charts of any asset are also a gauge of sentiment. The price movement over time, across different timeframes, represents fear and greed in the form of candles. With that in mind, the weekly price chart of BTC also reflected strong greed or bullishness.
A retracement to $77k, the 20-week moving average, would not quell this belief. At press time, it was unclear if such a drop should be expected. Analysis of on-chain metrics elsewhere showed that a price surge was more likely than further losses.
Source: Blockchain Center
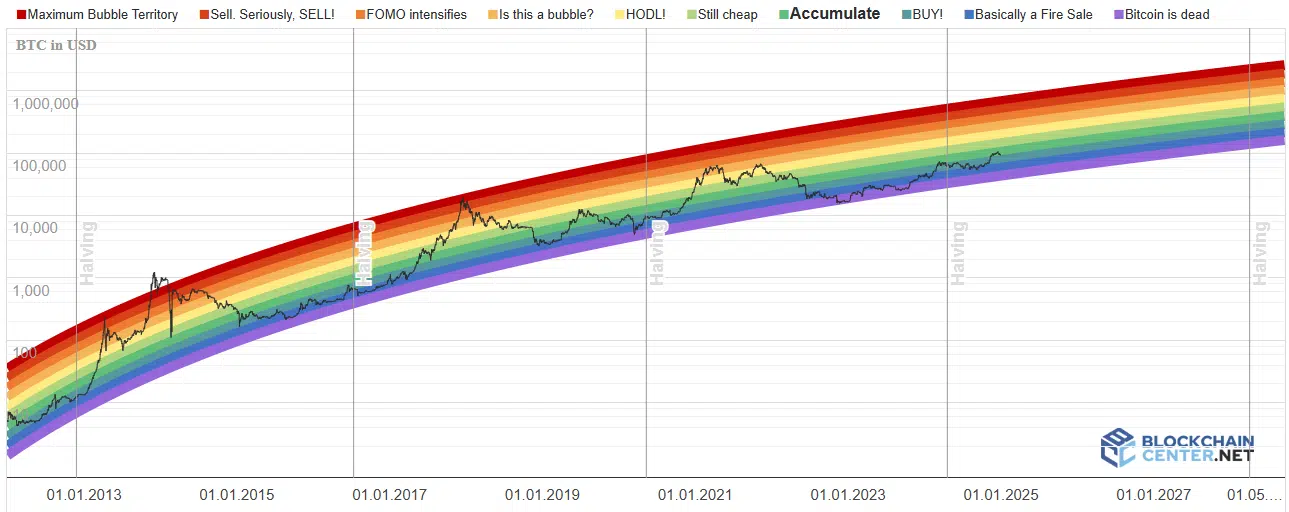
The Bitcoin Rainbow chart showed a bullish trend. Despite Bitcoin surpassing $100k earlier this month, the Rainbow chart still signaled “Accumulate.” Even if Bitcoin reaches $151k by the second week of February, the Rainbow chart would label it as “still cheap.”
Is your portfolio green? Check the Bitcoin Profit Calculator
In the last cycle, reaching the “Is this a bubble?” territory marked the peak. If this happens in November 2025, Bitcoin’s price would be $385k.
Disclaimer: The information presented does not constitute financial, investment, trading, or other types of advice and is solely the writer’s opinion

