Bitcoin
Bitwise Report: Bitcoin’s ‘real price’ deviation on a descent since April

Deviation is on a descent.
Since peaking at over $13,800, Bitcoin has been caught in a downward spiral. The pennant which surfaced in June has been dragging the price of the top cryptocurrency down to the four figure mark, but an unlikely statistic should buoy the market, at least in the regulators’ eyes.
The Securities and Exchange Commission [SEC] has been keeping a close eye on the cryptocurrency market, especially in light of the Bitcoin ETF applications on their table. Before them lie two applications, only one of which will meet its final fate in less than a month’s time, the application by Bitwise Asset Management and NYSE Arca.
In order to address the concerns of the SEC, Bitwise revised its report on the efficiency of the Bitcoin market, in their recent release. The report addressed custody requirements, futures versus spot market, and the overall price deviation of Bitcoin, which, according to Bitwise, is on a descent.
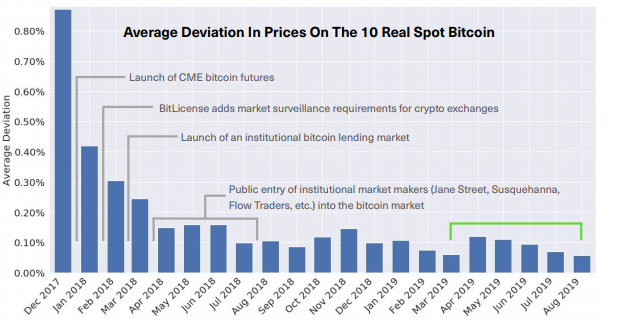
Bitwise, back in March, in their initial report classified the price of Bitcoin according to its price listing on ten “real exchanges,” a metric that has since been adopted by CoinGecko and Messari Crypto in their custom calculations. Charting this “real price” of Bitcoin, Bitwise suggested that the “real market is remarkably efficient.”

Source: Bitwise Report
With perspective, one can see that the Bitcoin market has not been as efficient as it is now. Back in December 2017, when the price nearly touched $20,000, the price deviation was over 0.8 percent and this was among the top 10 real exchanges only, mind you. With time and the coming and going of the crypto-winter, that deviation has since subsided, with the price deviation over the entirety of 2018 being less than 0.2.
Deviation, to some extent, has been tracking the volatility in the market. In April, the price of Bitcoin surged to over $6,000 and entered its ‘Golden Cross,’ sparking a bull-run. Hence, it bears no surprise that the price deviation in April saw an increase. However since then, the deviation has been decreasing.
May saw the deviation set at 0.1 percent, while July and August saw the difference at 0.06 and 0.05, respectively, a testament to the stabilizing price movement and the lack of volatility in the market.
Source: Bitwise Report
Volume on the other hand, is holding its own. The real-10 exchanges have seen a massive increase in their average daily volumes [ADV] since April. July topped the volume charts for the year, posting over $1.5 billion ADV for all the ten exchanges. A point of concern is the steep decline of ADV in August, as the figure dropped by over 30 percent to under $1 billion.

