Bitcoin’s uncertain sentiment foreshadows red flags on the horizon

The positive optimism around Bitcoin is slowly fading at the moment. A 6.03 percent slump over the last 24-hours saw Bitcoin drop below its strong support at $9300, a level that had been strongly held since the king coin breached its resistance on 5 February.

Source: Twitter
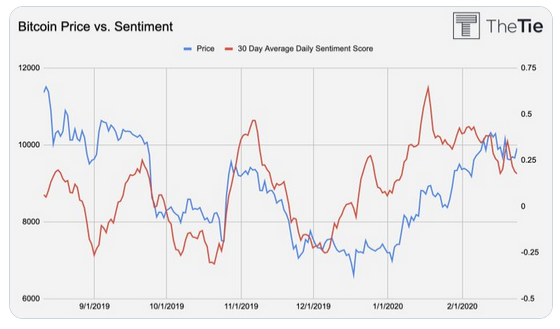
However, the sentiment has been on a downturn over the past week as well. According to the TIE‘s 30-day average daily sentiment score, a quantified metric to measure investor expectations from the future, Bitcoin’s score has periodically dropped since hitting a high on 17 January.
Although its daily average score remained above zero, the sentiment score has been negative for a total of eight out of the past 10 days. Such data sets suggest that the bullish pressure on the short-term charts is losing its momentum.
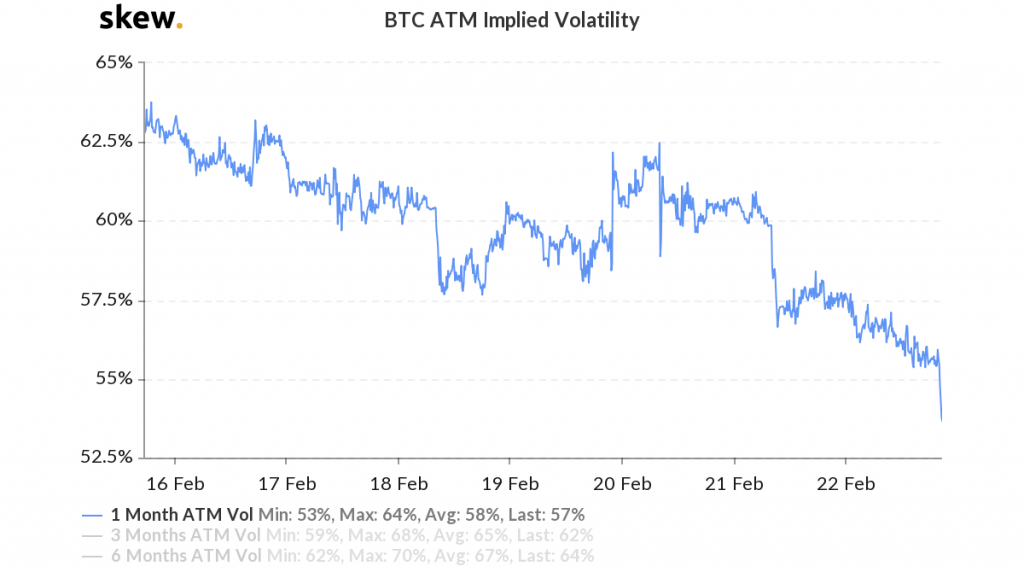
A similar trend can be identified on Bitcoin’s implied volatility charts as well.

Source: Skew
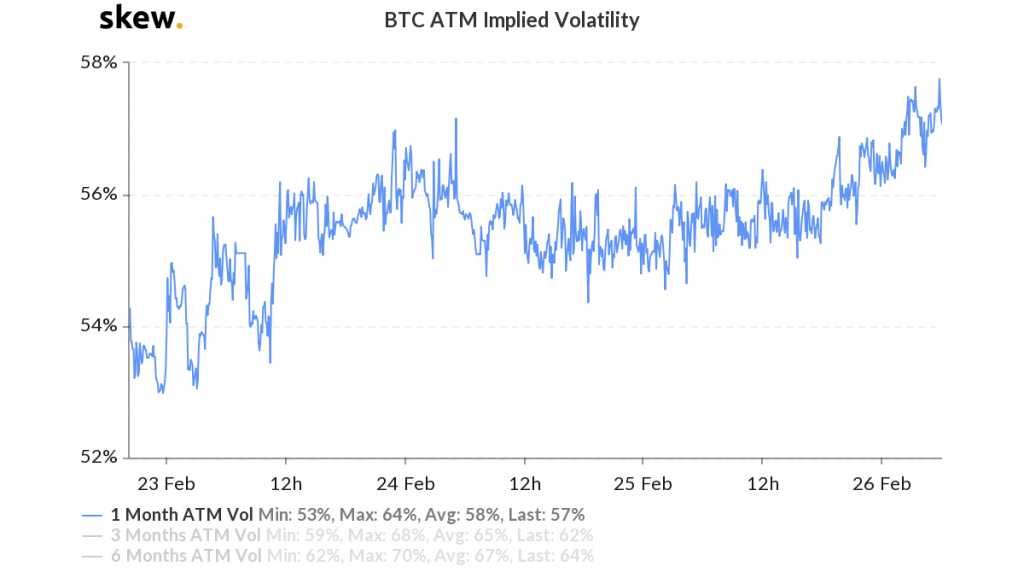
The implied volatility from 16 to 22 February fell periodically. Investors in the space speculated that the decreasing implied volatility would allow a period of stabilization from ta valuation point of view. However, the implied volatility witnessed a spike over the past few days, as observed in the chart below. This opens up the possibility for more price turbulence, something that may suggest that price stability might not be in the cards for the short term.

Source: Skew

Source: lunarcrush
Lunarcrush’s Price v. Bullish Sentiment chart for Bitcoin highlighted a similar drop as well, something that was observed on the chart as well. After registering a high on 24 February, the trend has drastically changed over the past 48 hours, with the market picturing a bearish reversal.
Considering the fact that Bitcoin has been bullish for a greater part of 2020, corrections at the moment can be considered healthy. However, the continuation of such a trend where consecutive drops are not met with price spikes may signal red flags for the valuation in the long-term.


