Bitcoin

Bitcoin’s support test: Can bulls defend key levels amid market volatility?
Posted:
Journalist

Key Takeaways
What can the short-term BTC trader’s game plan be?
Traders can use the recent range formation to form their biases. Right now, the bounce from the lows encouraged longs.
What are the threats long positions can face?
The OBV hinted that buying pressure was still weak, which meant a move back to the range highs might need more time. Another dip to the range lows was also a possibility.
Crypto analyst Maartun noted that the Bybit exchange saw heavy buying pressure for Bitcoin [BTC]. The taker buy/sell ratio surged to 11.6, showing a swift increase in taker buy orders.
It indicates aggressive long positioning and could be an early sign of a short-term rally.
This news would be welcome for traders. Bitcoin has formed a range that extended from $107.5k to $124.5k, with the mid-range resistance at $116.1k.
These were the key levels to watch until the range extremes are convincingly breached.
Bitcoin to climb to $116.1k this week?
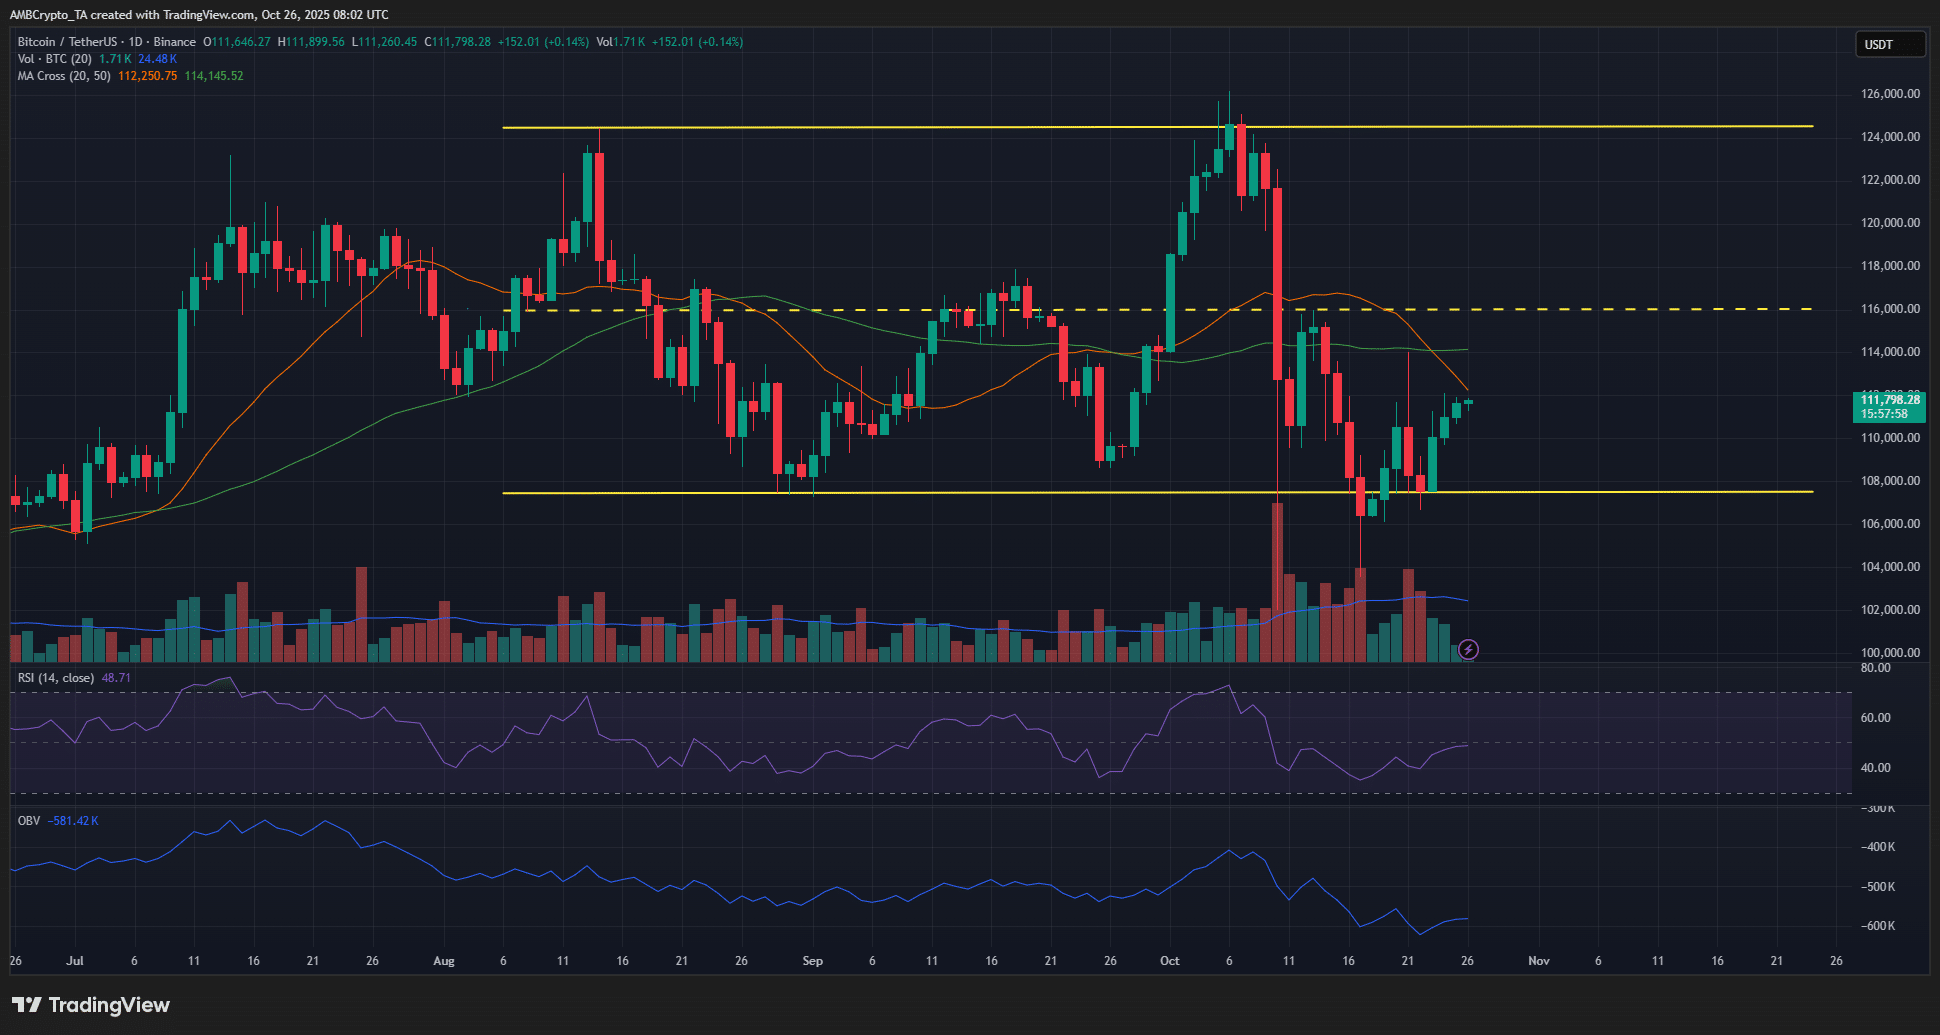
Source: BTC/USDT on TradingView
On the 1-day timeframe, Bitcoin had a bearish structure after dropping to $106.4k at the day’s close on the 17th of October.
This was also below the range’s low, but BTC has rebounded since then, testing $107.5k as support on Wednesday, the 22nd of October.
The moving averages reflected bearish momentum. The RSI was at 48.7, showing momentum was bearish, but it could flip either way in the coming days.
The OBV’s steady decline on the daily timeframe showed that sellers have the upper hand on this timeframe. However, traders should remember to trade the range until it is clearly invalidated.
Hence, any dips to the $107k area would represent a chance to buy Bitcoin at the local lows.
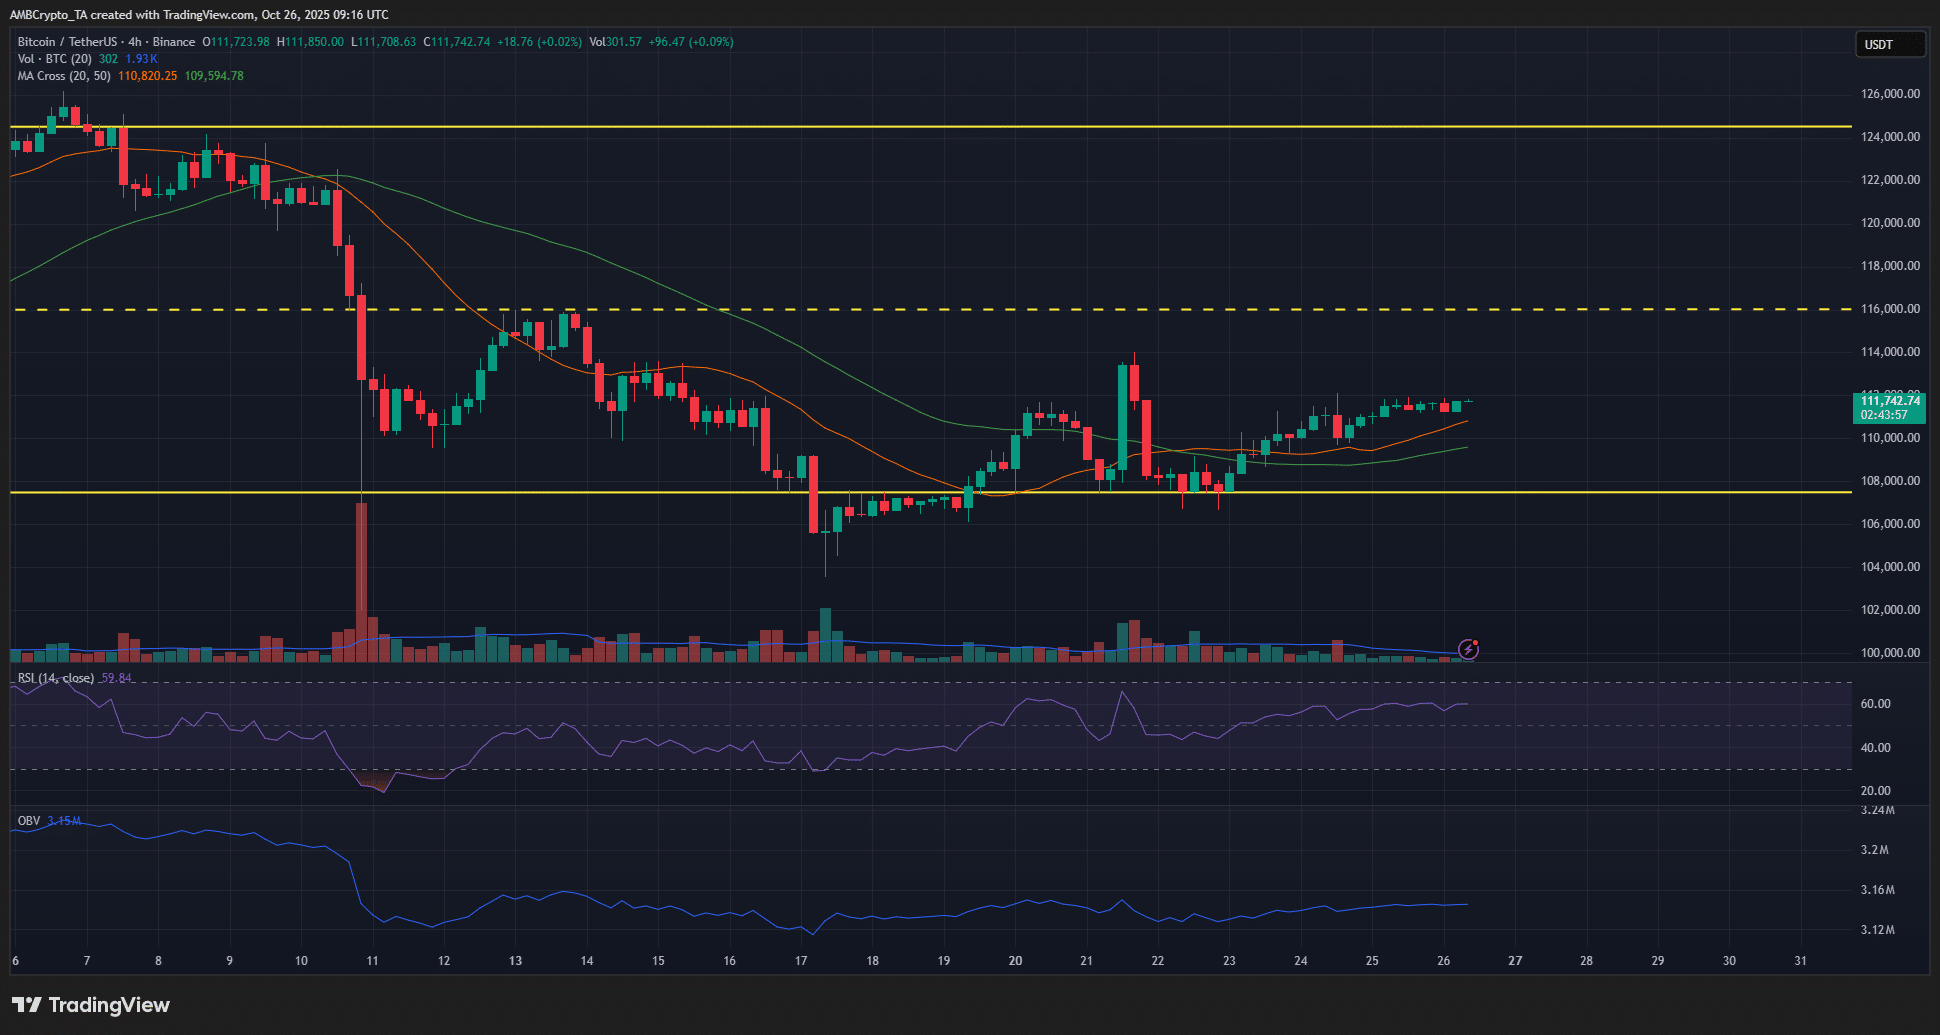
Source: BTC/USDT on TradingView
The 4-hour chart showed the beginning of a price bounce over the past ten days. This rebound began from the liquidity pocket under the range lows at $107.5k.
The RSI and OBV were slowly climbing higher, showing rising bullish momentum and a slow increase in buying pressure, respectively.
The moving averages also formed a bullish crossover and would serve as dynamic support to BTC. Overall, there was hope for a move to the opposing end of the range at $124.5k.
Disclaimer: The information presented does not constitute financial, investment, trading, or other types of advice and is solely the writer’s opinion


![Real-world assets [RWA]: How to invest in Gold & Real Estate on-chain](https://eng.ambcrypto.com/wp-content/uploads/2026/02/Samyukhtha-5-400x240.webp)