Analysis
Bitcoin’s retest to $3,850 might be incoming; $4,200 in the next 24 hours

Bitcoin’s drop comes at a time of massive global uncertainty with a pandemic on the hand. This drop took Bitcoin from $9,000 to $3,800, an approximate 61% drop in less than 6 days. Not only has this triggered liquidations in billions but has also caused widespread miner capitulation, causing the hash rate to slowly decline. If that wasn’t enough, the charts still look bearish and show the possibility of a retest at recent low [$3,850].
Hourly

Source: BTC/USD TradingView
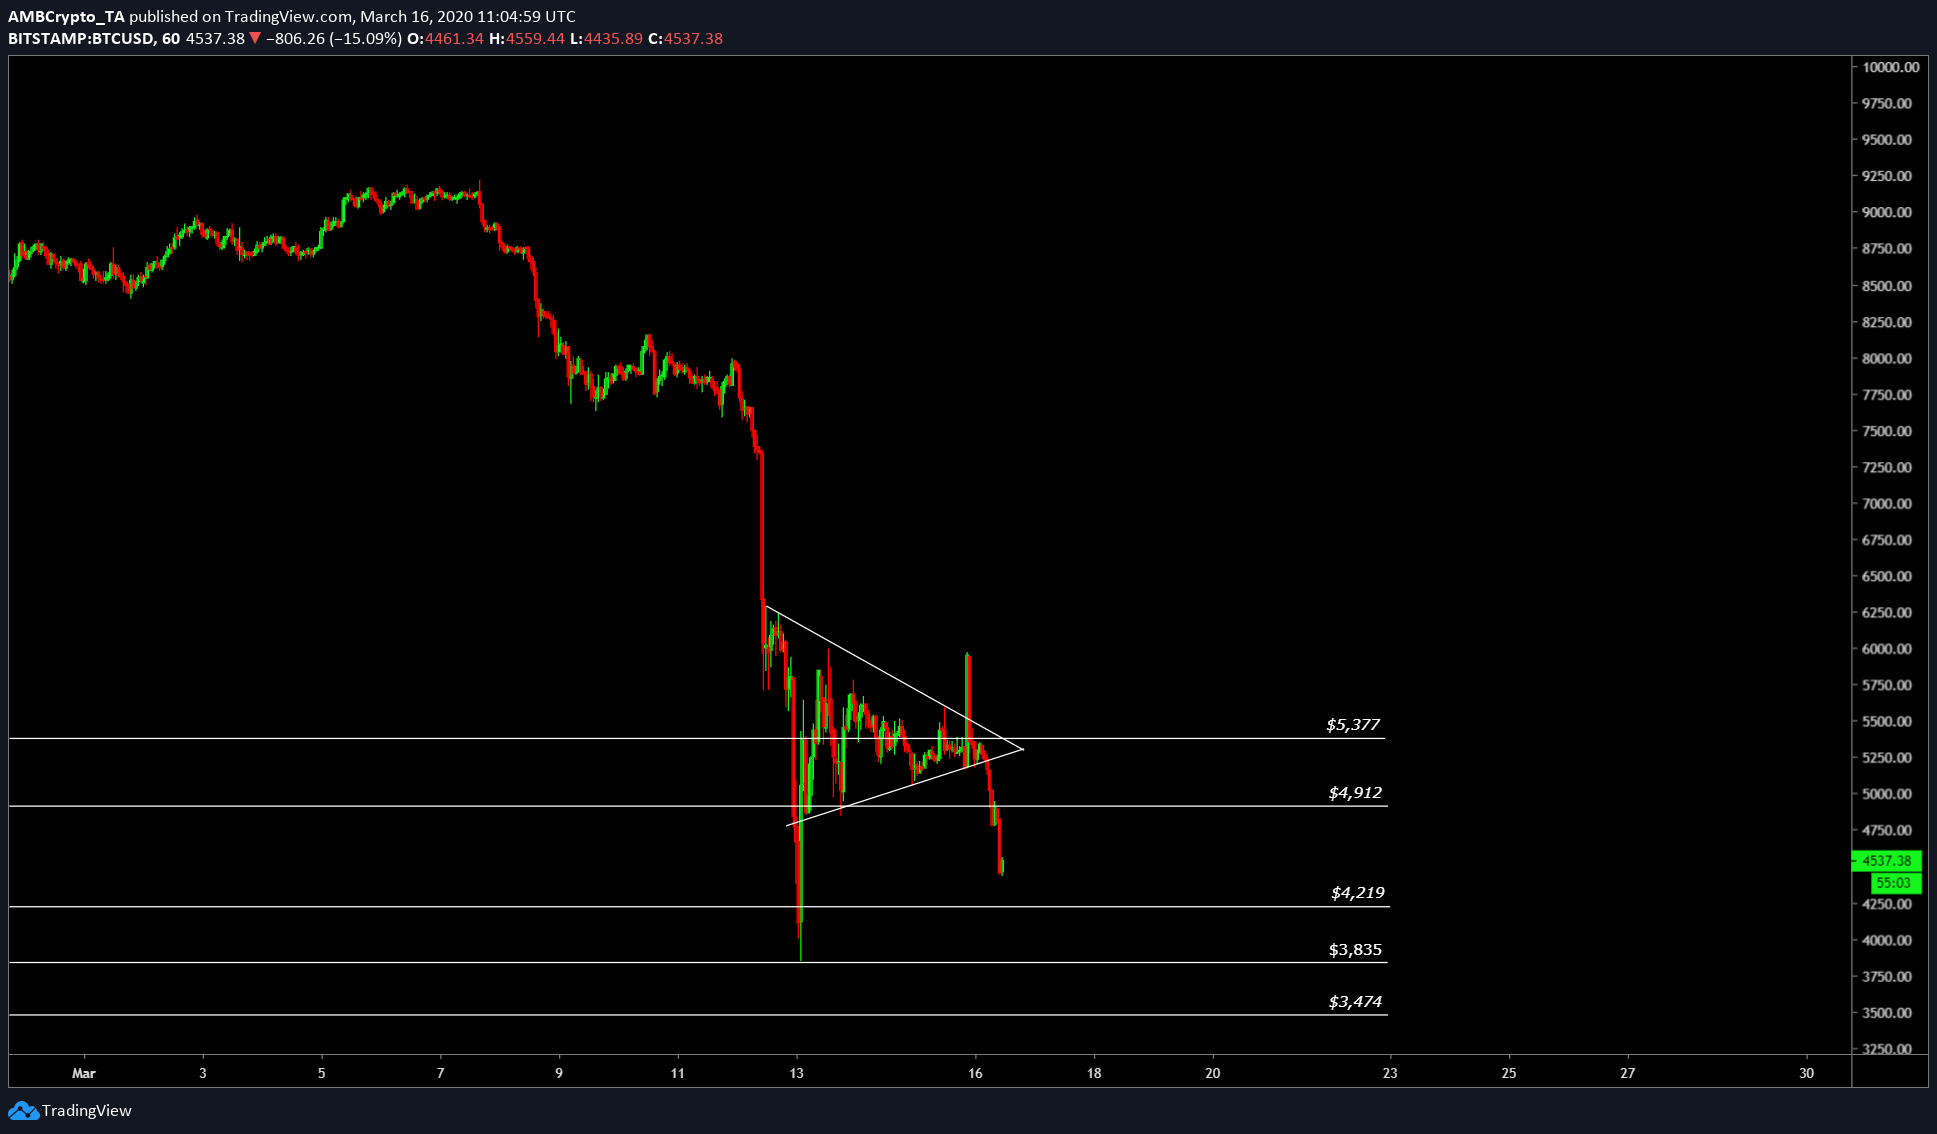
In the one-hour chart, the price has already broken out of the symmetrical triangle and is continuing its search for support. Since there was a single candle from [approx.] $4,000 to $5,000 in 2018, the drop that would occur now would be fatal for Bitcoin.
At press time, BTC is trading at $4,400 and looks like the drop will continue till the next support at $4,200. There is a chance that Bitcoin consolidates here and moves sideways but an eventual drop seems plausible. The departure from $4,200 would yield in price retesting the recent low of $3,850 or find support at $3,835. RSI also looks like it will reside in the oversold zone a little longer.
To conclude, the one-hour chart showed a drop to $4,200 and in an extremely bearish condition, $3,835.
Weekly
Source: BTC/USD TradingView
The most accepted Bitcoin’s narrative was it being an ‘uncorrelated asset’. However, this drop seems to have upset this narrative. As Bitcoin dove with the stocks.
The weekly candle of Bitcoin has already registered a 17% drop in value since its open earlier today. The red candle indicated a revisit to the wick formed in the previous weekly candle that ranged form a whopping $8,200 to $3,850. Further, the drop has caused 20, 50, 100, and 200 weekly moving average to be breached, which painted a rather bearish picture.
Although RSI in the weekly time frame hasn’t hit the oversold zone, it indicated that it is reaching for it. The last time this happened was in December 2018, during the hash rate war, brought about during the Bitcoin Cash split to Bitcoin Cash and Bitcoin SV. Considering the bearish momentum, if the price doesn’t stop at RSI’s oversold zone, there is an absolute possibility for it to retest $3,122.
Luckily, as seen in the hourly chart, there is more than one support between $4,200 and $3,122, ie., $3,835 and $3,474.
Additionally, with Bitcoin halving two months away and the price dropping by more than 50%, miners are definitely facing the heat. However, the difficulty will be adjusted eventually.
Conclusion
Bitcoin’s dip to $4,200 in the next 24 to 48 hours is on the horizon; however, an eventual drop to subsequent levels is yet to be determined. An extremely bearish scenario would bring this to fruition. A retest of the previous low at $3,122 seems plausible as well, but this needs to have a mass dump causing widespread panic and FUD, pushing the price even lower.

