Analysis
Bitcoin’s day in the sun ends with breach of ascending channel

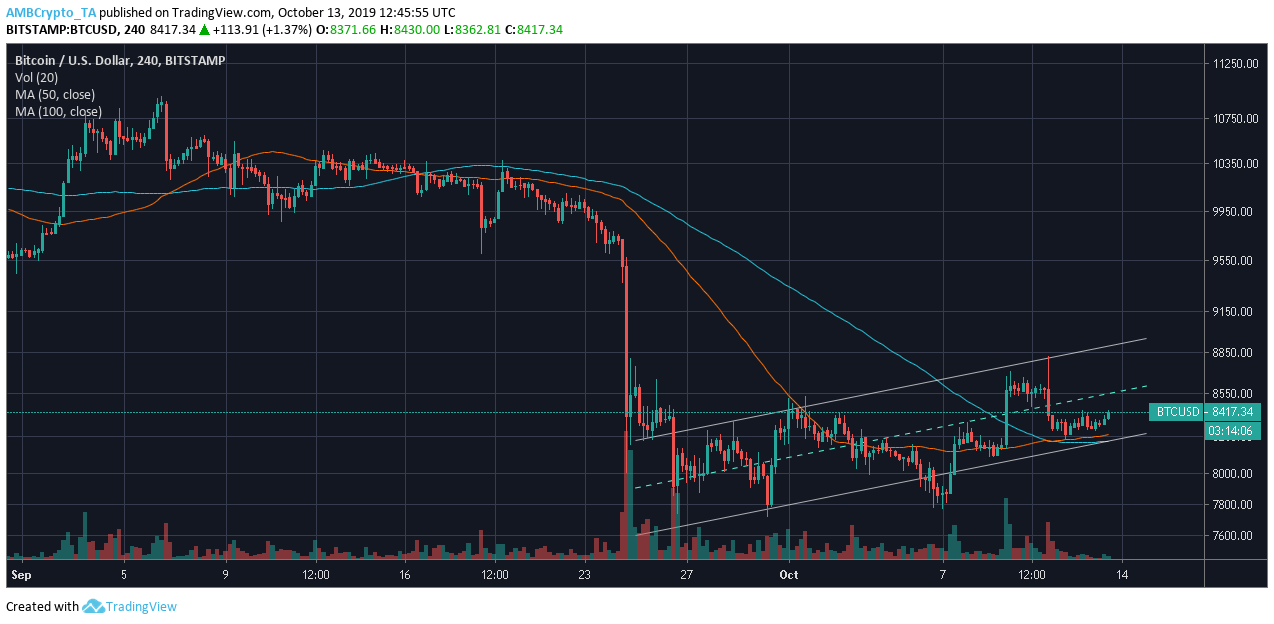
Bitcoin’s price noted a great fall by the end of September where the coin’s value fell under $10k. However, the price of the coin may have to face other bearish turbulence in the market as 50 moving average laid under the 100 moving average due to a recent crossover.
The longer-term chart of BTC reflected an incoming fall in the price of the coin, despite its efforts of making a recovery.
4-hour

Source: BTC/USD on TradingView
The 4-hour chart suggested an ascending channel making its way in the BTC market. Conceived as a bearish pattern, ascending channel is characterized by two parallel upward rising line, that marked the higher highs of BTC at $8,248.56, $8,446.69, and $8,725.55 and higher lows at $7,778.18, and $8,115.68. With the price marching along with the rising trend, a breakout toward the bearish end of the coin may be imminent.
100 moving average zoomed past the 50 moving average two days ago. Previously, when 100 moving average led the BTC charts, the coin fell by 17.81% in 24 days. However, the moving averages laid under the candlesticks, giving way to the bulls and reducing the bearish momentum.
Source: BTC/USD on TradingView
MACD line that also reflected a bearish market, at press time, may reverse the trend by undergoing a crossover with the signal line. Relative Strength Index reflected that the coin was entering the overbought zone.
Conclusion
Even though the indicators favored the bullish side of the market, rising price of the king coin may fall on the breach of the ascending channel.

