Bitcoin’s 10-day volatility drop could be first step towards normalcy

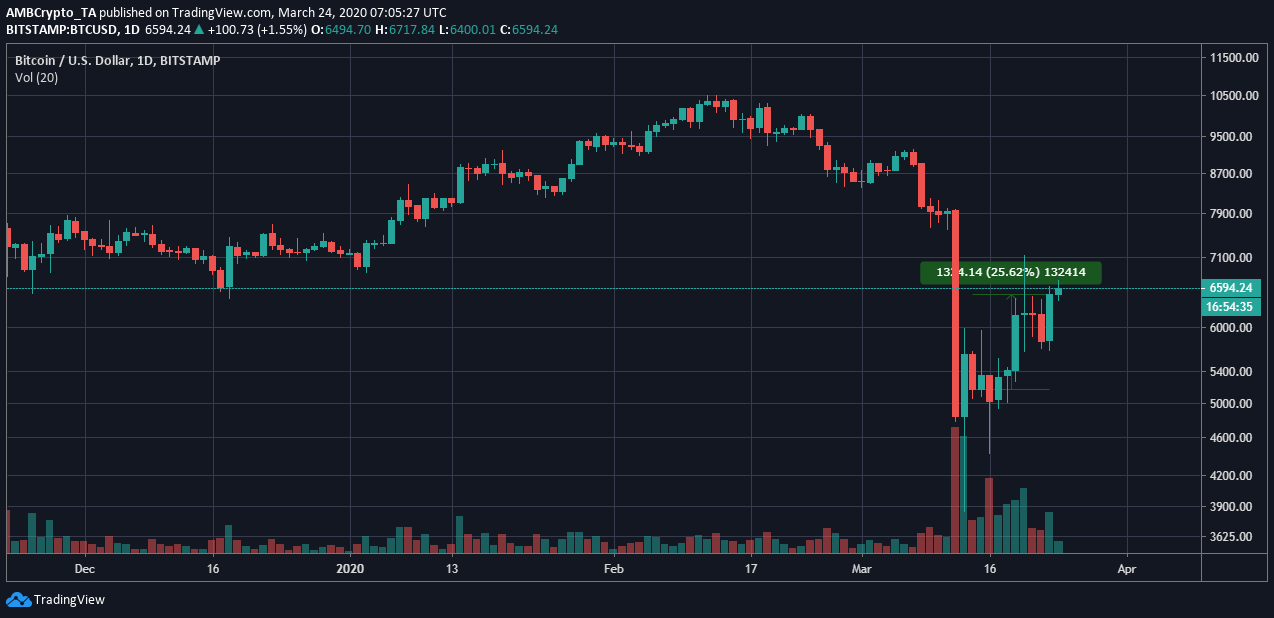
Bitcoin was continuing to navigate through an unstable March, with the crypto-asset bouncing between the range of $5800 and $6600 since 19 March. And while Bitcoin managed to briefly breach $7000 on 20 March, its valuation soon descended below $6600 within 4 hours.
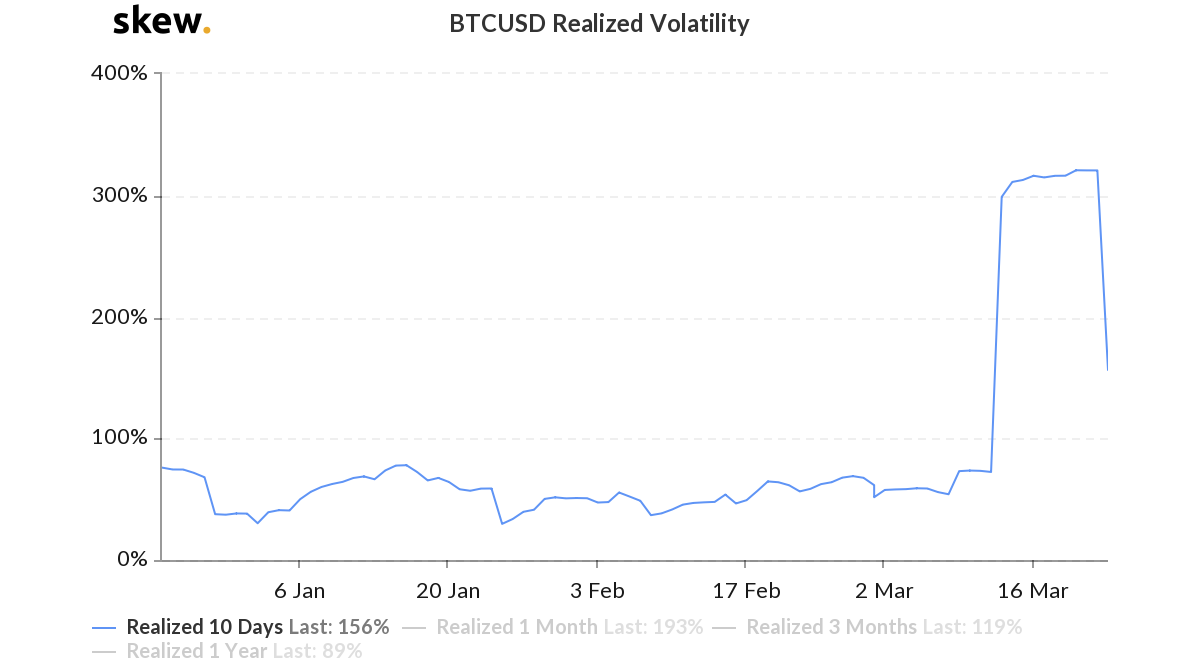
Considering the fact that high volatility has been the theme of the month, Bitcoin’s realized volatility took a massive tumble on 23 March.

Source: Skew
According to the attached chart, after maintaining volatility levels of above 300 percent since 14 March, the realized volatility dropped from 321 percent to 156 percent over a span of 24-hours. Observing the data superficially may suggest a return to stability for the market, but it is important to note that the aforementioned volatility chart is constructed based on the past 10 days only.

BTC/USD on Trading View
Since 14 March, Bitcoin has undergone a positive pullback of 25 percent after the drastic drop in price on 12 March. While the spike of 25 percent in 10 days is not unheard of in the crypto-market, calculating the volatility index based on that period will mostly adhere to stable levels.

Source: Skew
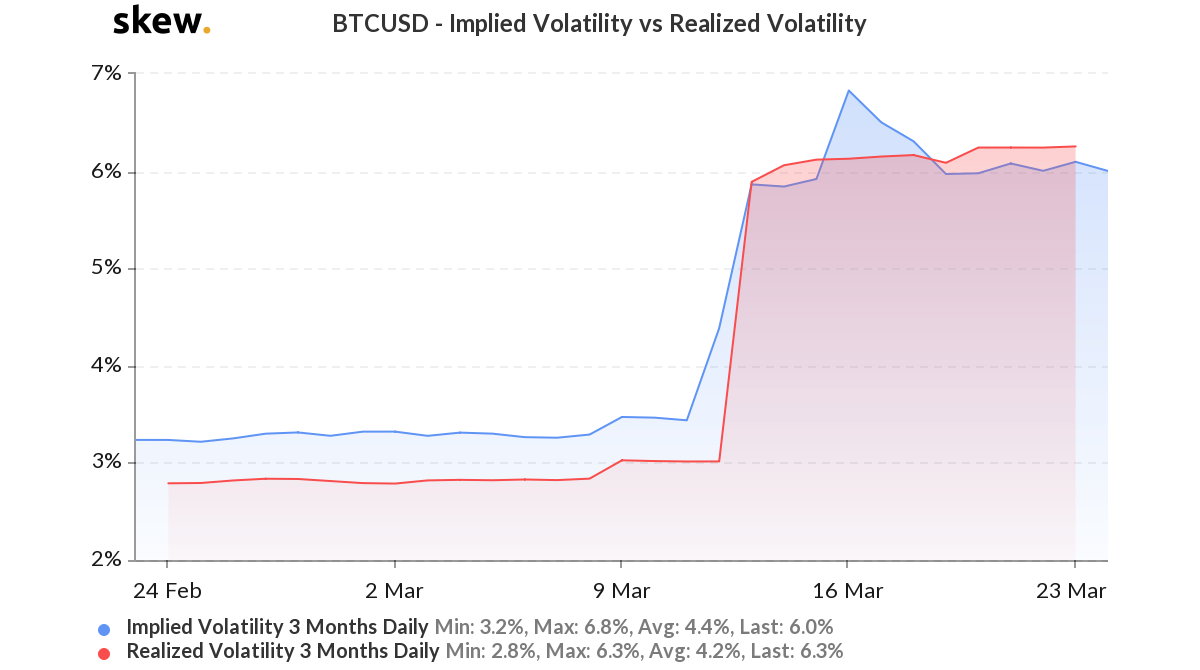
On the contrary, Bitcoin’s realized volatility continued to mediate under the implied volatility levels, indicating that the market continued to act out of nature in terms of price movement in the industry.
Since 19 March, realized volatility for Bitcoin has been above 6.1 percent on a consistent basis, whereas implied vol levels have been just under 6 or 6 percent on the charts.

Source: bitpremier
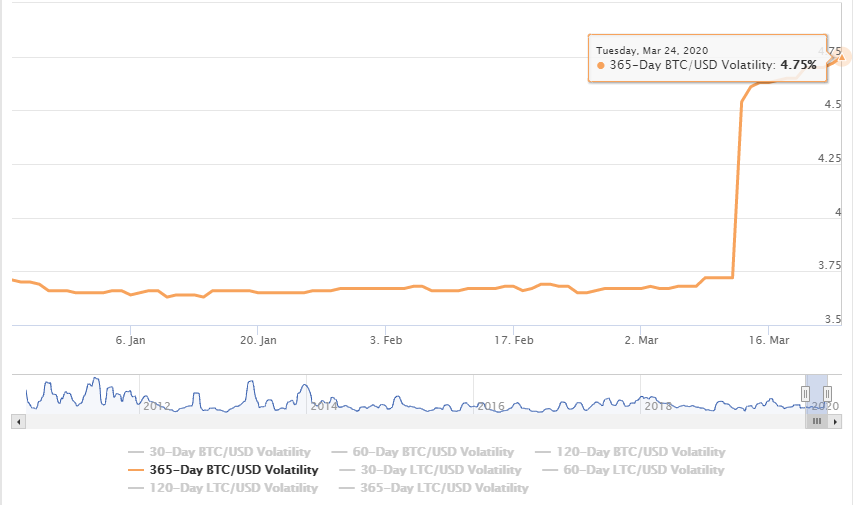
Bitcoin’s annualized volatility level over a span of 365 days also remained high. According to the attached chart from bitpremier, volatility levels have spiked from 3.72 percent on 12 March to 4.75 percent, at press time.
Hence, price turbulence from a long-term perspective remained evident in the charts.
Short-term change key in the long-run?
The volatility levels may have dropped keeping only the past 10 days in mind, but it could manifest a drop over the long-term as well. Bitcoin’s movement on 12-13 March had turned the industry upside-down in terms of devaluation and certain fundamental metrics were spiking off the charts as well.
Hence, it is essential that the taper-off period is initiated from the short-term charts, an observation that may eventually change in the long-term analysis as well. Considering volatility levels are still quite high, Bitcoin is potentially open t0 more price swings, but reduced turbulence over the past 10 days is a start needed by the industry for a stable future in the near-term.


