
Disclaimer: The information presented does not constitute financial, investment, trading, or other types of advice and is solely the writer’s opinion.
- The triangle pattern and the bullish structure showed buyers had the upper hand.
- The repeated failure to break out past the $37.5k resistance raised a concern that the market could be overextended.
Bitcoin [BTC] continued to trade beneath the $37.5k resistance. The market saw an increase in trading volume and Open Interest in the BTC futures market. Whales were also looking to long BTC, as revealed in an earlier report by AMBCrypto.
The hash rate was also up, showcasing the network’s good health. Do these positive findings mean that traders could be confident of another leg higher for the king of crypto?
The bullish chart pattern was still in play
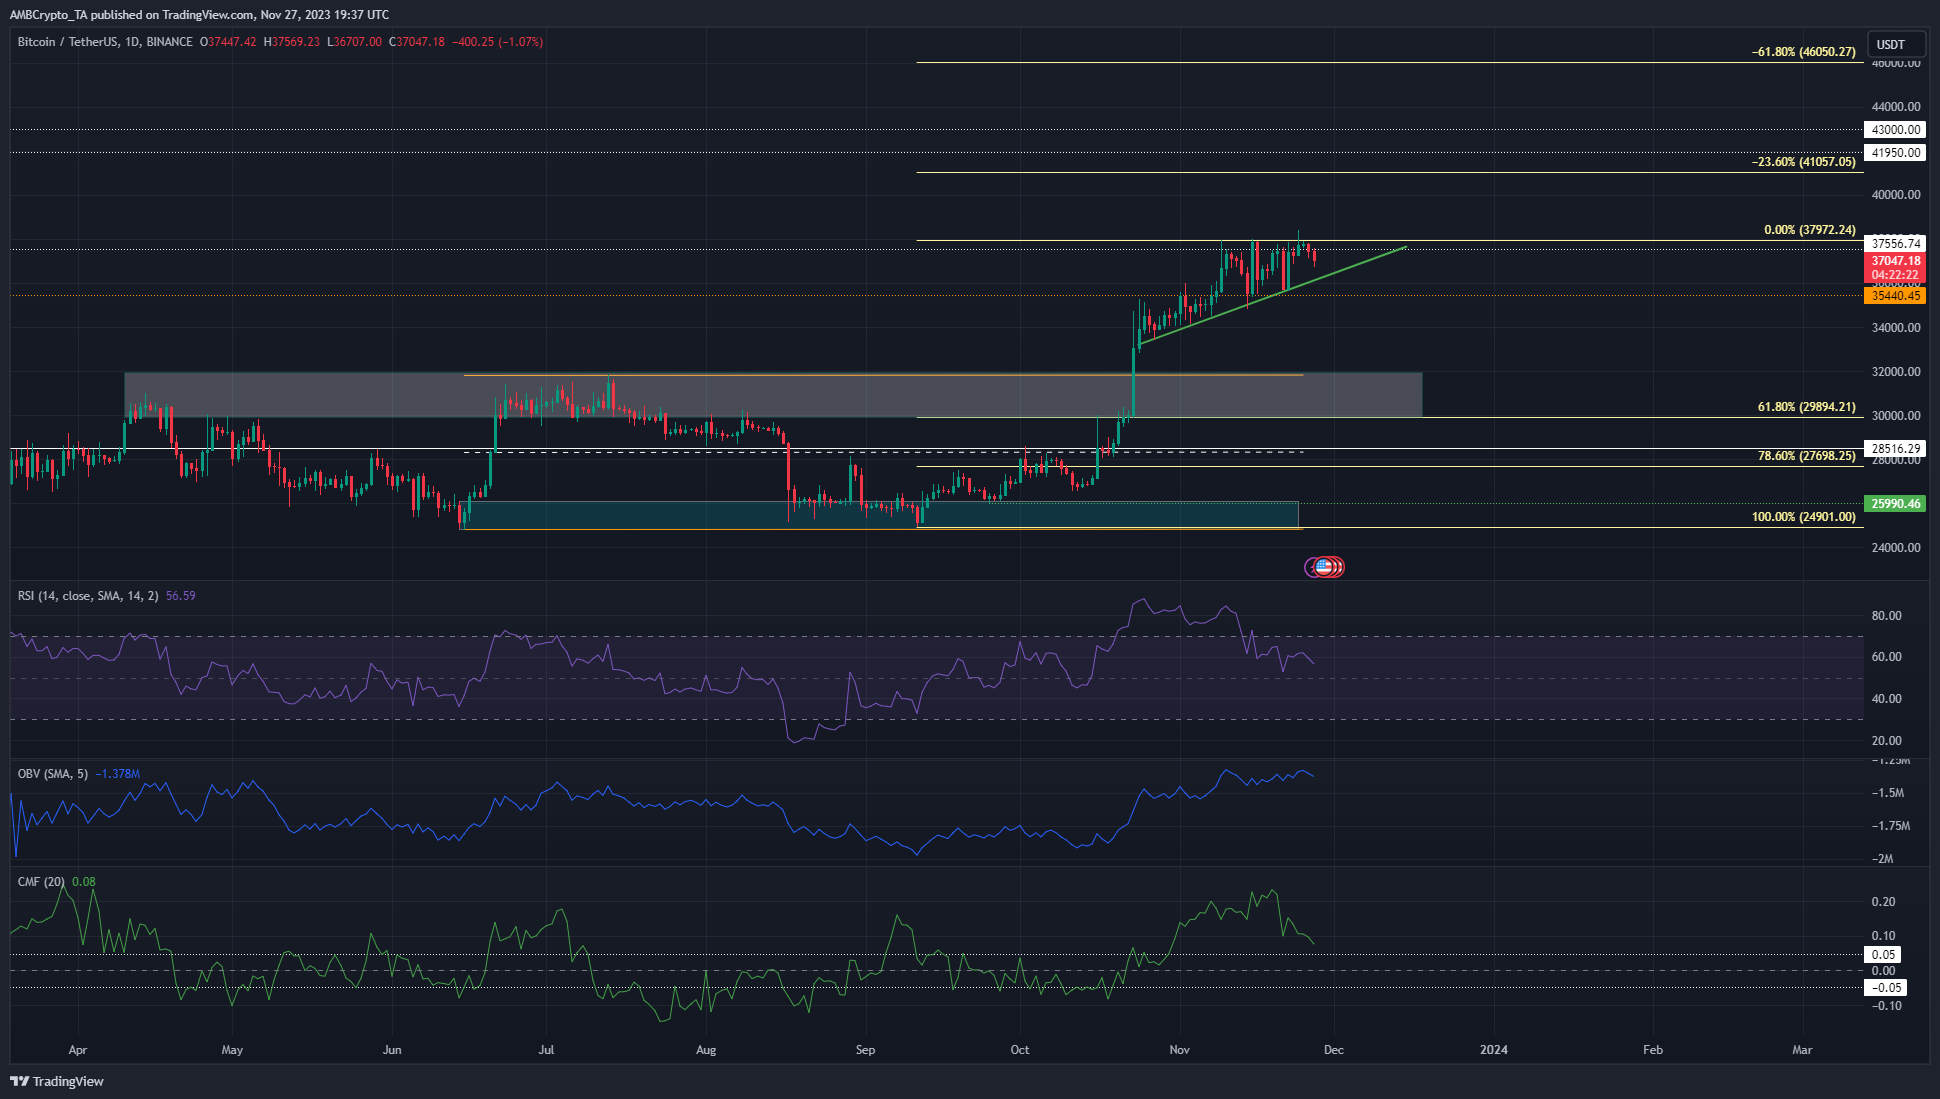
Source: BTC/USDT on TradingView
The green line represented an ascending trendline support for BTC that has been present since 25th October.
Meanwhile, the $37.5k mark has been resolute thus far in hampering bullish progress. The past three weeks saw BTC post a series of higher lows, forming an ascending triangle pattern.
This pattern was expected to see a bullish breakout targeting $42k. To the north, the $41k-$43k represented a higher timeframe resistance zone. The Fibonacci extension levels (pale yellow) noted that the next points of interest above $37.5k lie at $41k and $46k.
The market structure of BTC was bullish due to the formation of higher lows, and the RSI backed this observation. It was yet to dip below the neutral 50 mark, which would signal a possible shift in momentum.
The On-Balance Volume also continued to rise higher. The Chaikin Money Flow (CMF) showed significant capital inflow with a reading of +0.08.
On the other hand, a daily session close below $35.4k would flip the market structure bearishly. Moreover, the RSI and BTC prices formed a bearish divergence, which suggested a pullback could be inbound.
BTC exchange flow suggested accumulation was in play
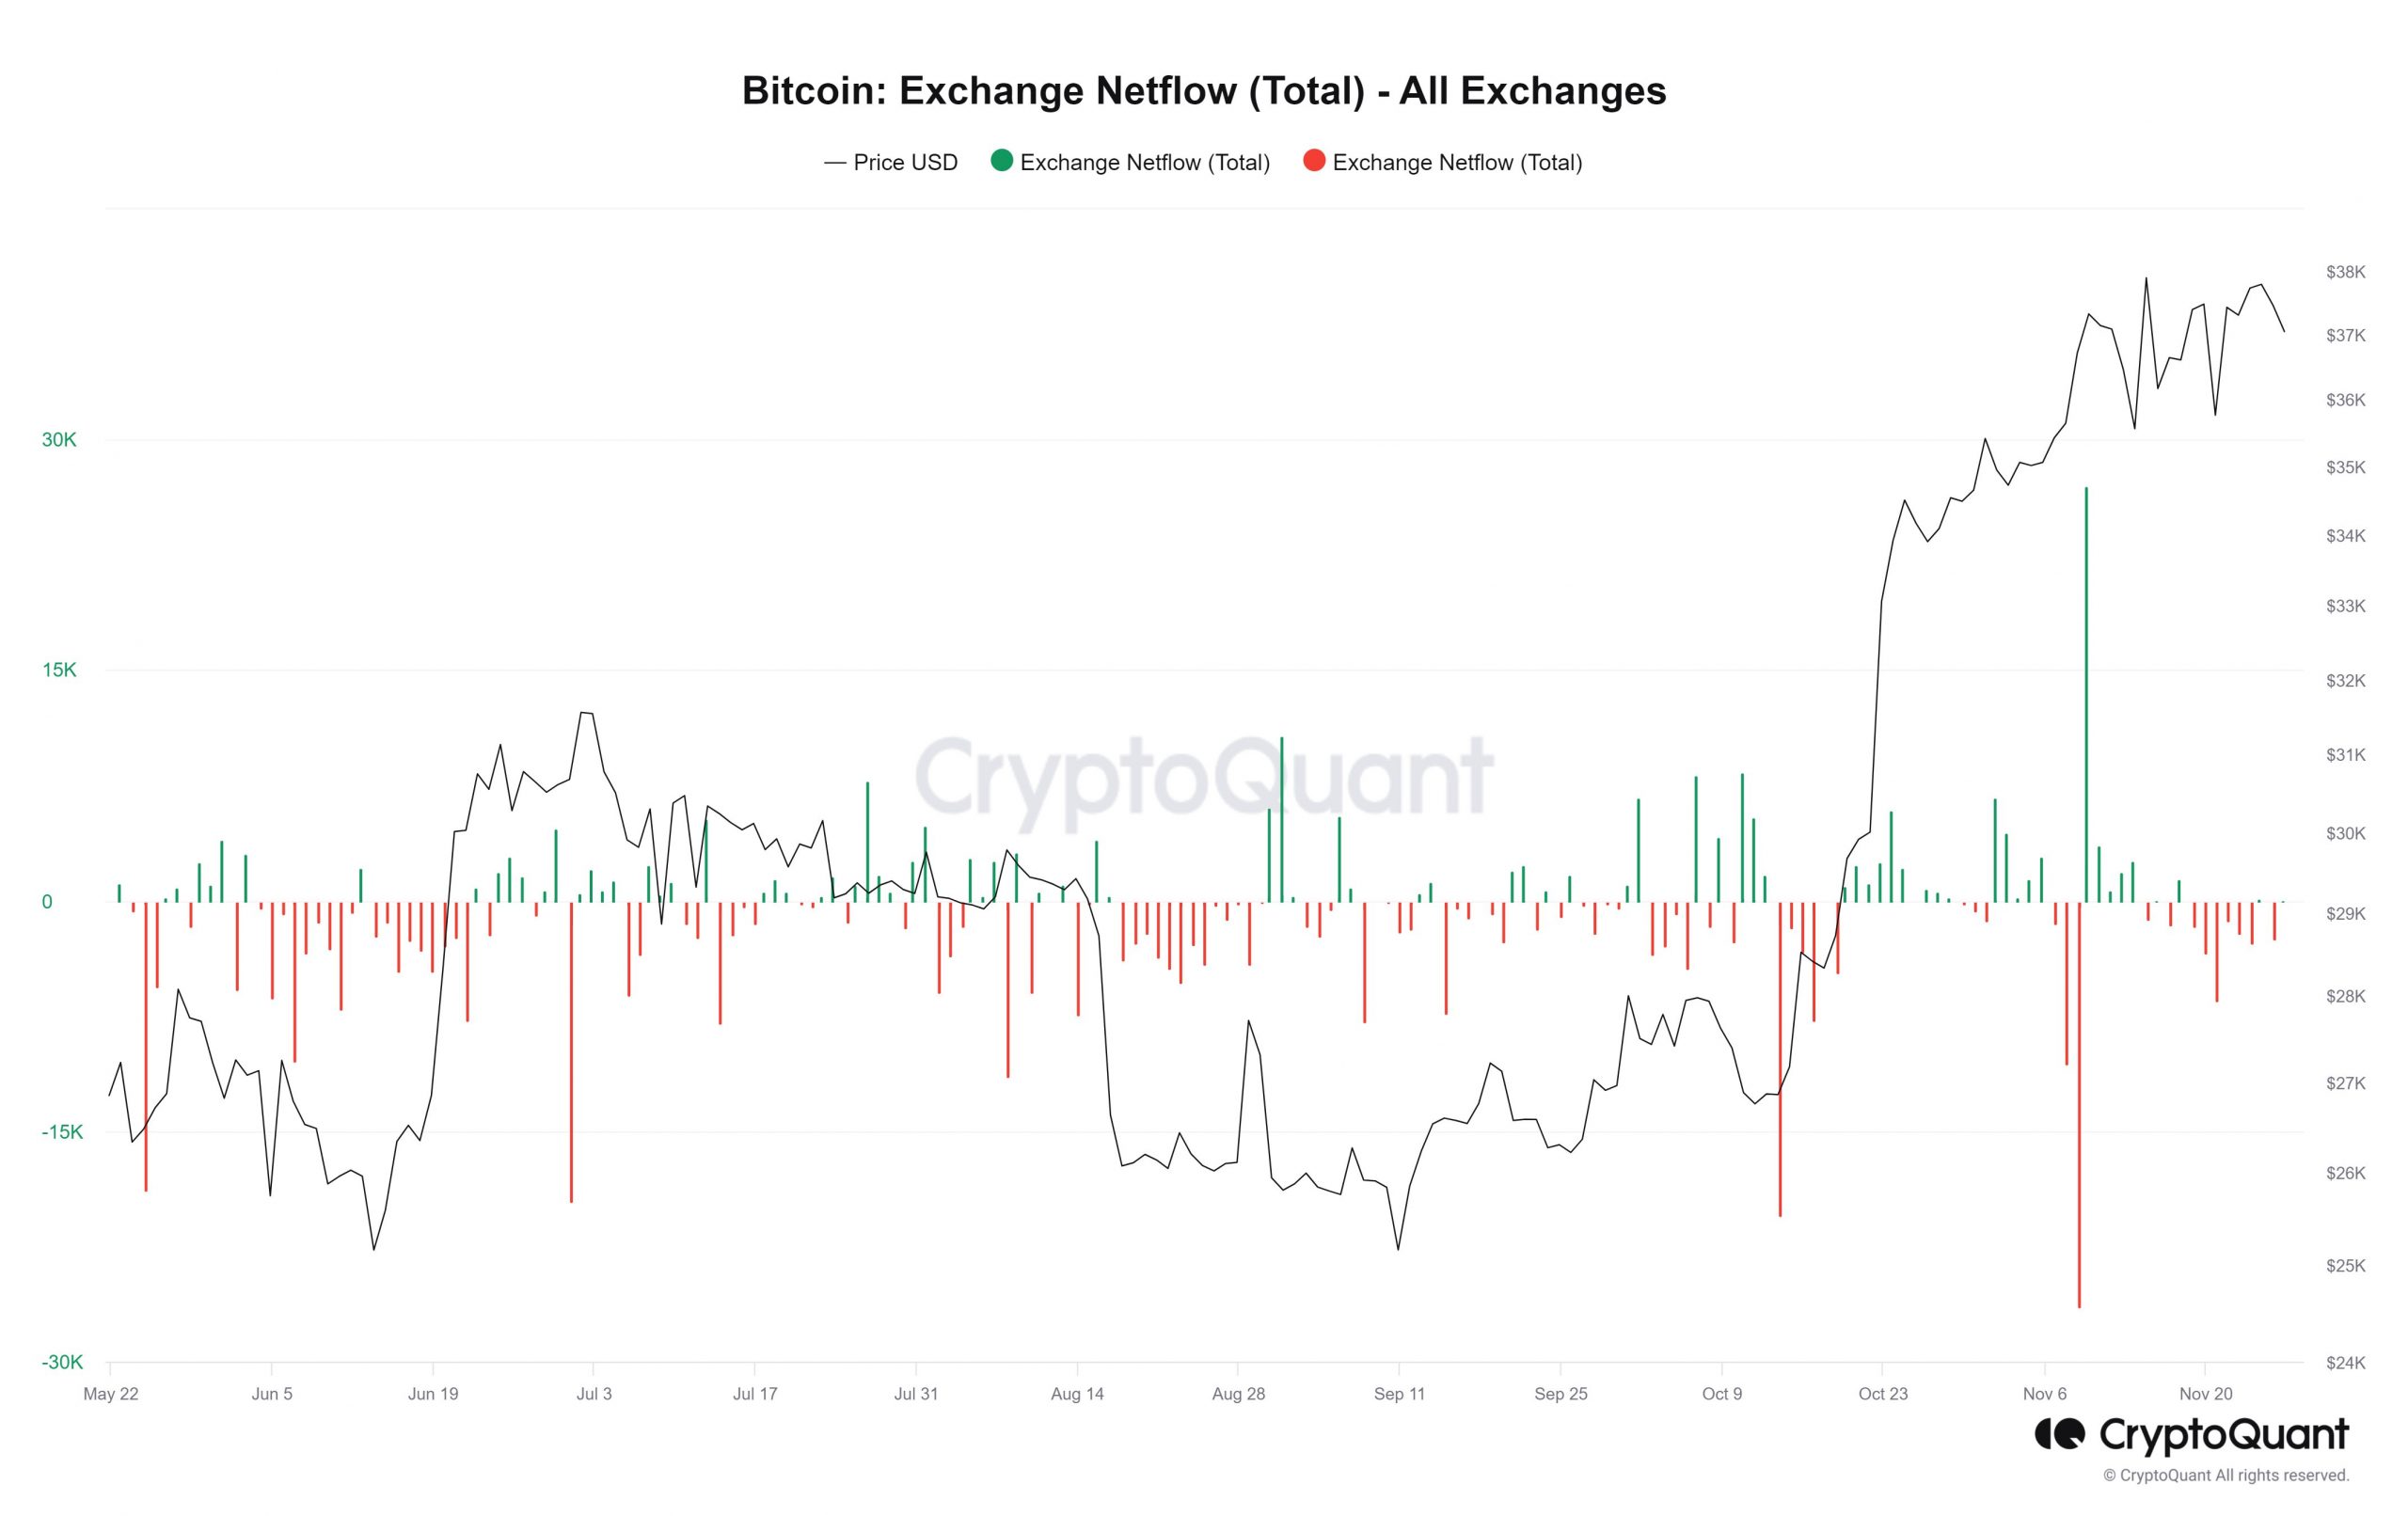
Source: CryptoQuant
AMBCrypto analyzed data from CryptoQuant to examine Bitcoin flow into and out of exchanges. The exchange netflow metric above was among the prime candidates to explore this aspect of on-chain data.
Read Bitcoin’s [BTC] Price Prediction 2023-24
The chart showed that the past ten days saw more BTC leaving exchanges than entering them. This meant that market participants continued to buy the asset and send it off the exchange to private wallets or cold storage.
It was also a sign of accumulation and indicated that another price move higher was likely.