Bitcoin trading – Are we in for another sell-off?

Every time Bitcoin moves up or notes a consolidation, there’s the question of a sell-off. Since the cryptocurrency markets are so volatile, you can’t blame traders or even investors for cashing in their investments at a significant profit. The current market is no different.
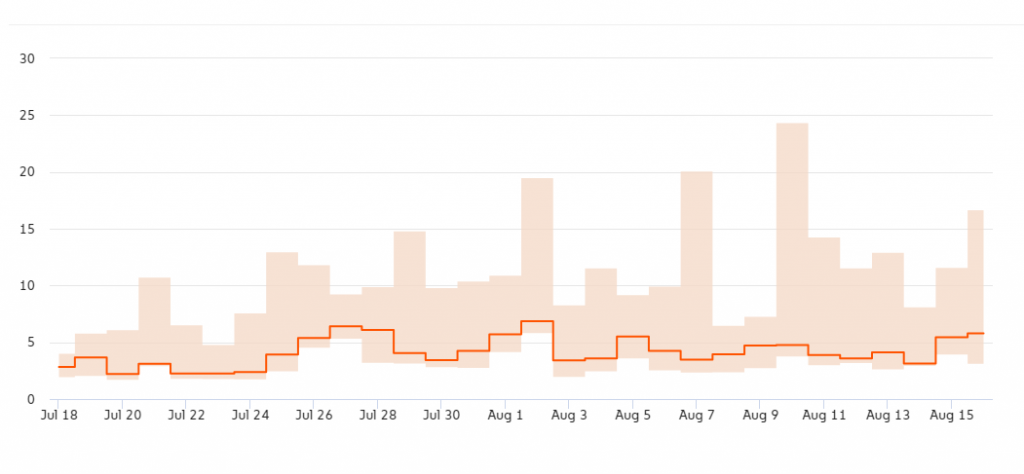
According to data from Chainalysis Markets, inklings of a sell-off are beginning to emerge. The median trade intensity over the last trading day, i.e on 16 August, was estimated to be 5.44, marking the single largest one-day increase in over 3 months.
Trade intensity, according to Chainalysis, “compares the value of order book trades to exchange inflows.” This metric indicates how quickly Bitcoin flows into an exchange versus how quickly it’s traded. It should be noted here that “traded” does not mean liquidated for fiat currency as market participants could either be trading Bitcoin for stablecoins or altcoins. Regardless, this suggests a move out of holding Bitcoin, indicative of a sell-off.
The last time trade intensity was this high was on 2 August, a day when the price crashed by 8 percent in an hour following its push over $12,000. At that time, Bitcoin’s trade intensity was 6.84, the highest it had been since mid-July. The lowest trade intensity for Bitcoin was on 14 August at 3.12, as the price was once again moving back up to $12,000.

Bitcoin trading intensity | Source: Chainalysis
Speaking to AMBCrypto, the Chief Economist at Chainalysis, Philip Gradwell, stated that this metric for the Bitcoin-trading market has been surging, while the same for other cryptos has been falling.
“If this [trade intensity] is low then it suggests that there is more cryptocurrency arriving than orders being made. Recently this has been high, especially for bitcoin – it has dipped recently for Ethereum.”
Bitcoin’s contrasting intensity with Ethereum is interesting and is a testament to the difference in their respective price increases. Ethereum, even prior to its breakout over $400, had a better Q2 2020 than Bitcoin, with ETH increasing its share in the overall cryptocurrency market capitalization by +1.6 percent, compared to Bitcoin’s +0.3 percent.
As things stand, Bitcoin’s market capitalization dominance is 58.37 percent, down from over 67 percent prior to its third halving in May. Unsurprisingly, the altcoin which ate up the king coin’s lost market share was Ethereum, with its market capitalization share at 12.96 percent at press time, an increase of 4 percent since May.
With the collective coin market capitalization at $374 billion, a single percent increase accounts for $3.7 billion. With the backdrop of Ethereum gaining strength, Bitcoin’s bull rally has not deterred traders from opting for the altcoin over the king coin.


